Marketing Conversion A/B Testing: Does Advertising Increase Conversion?

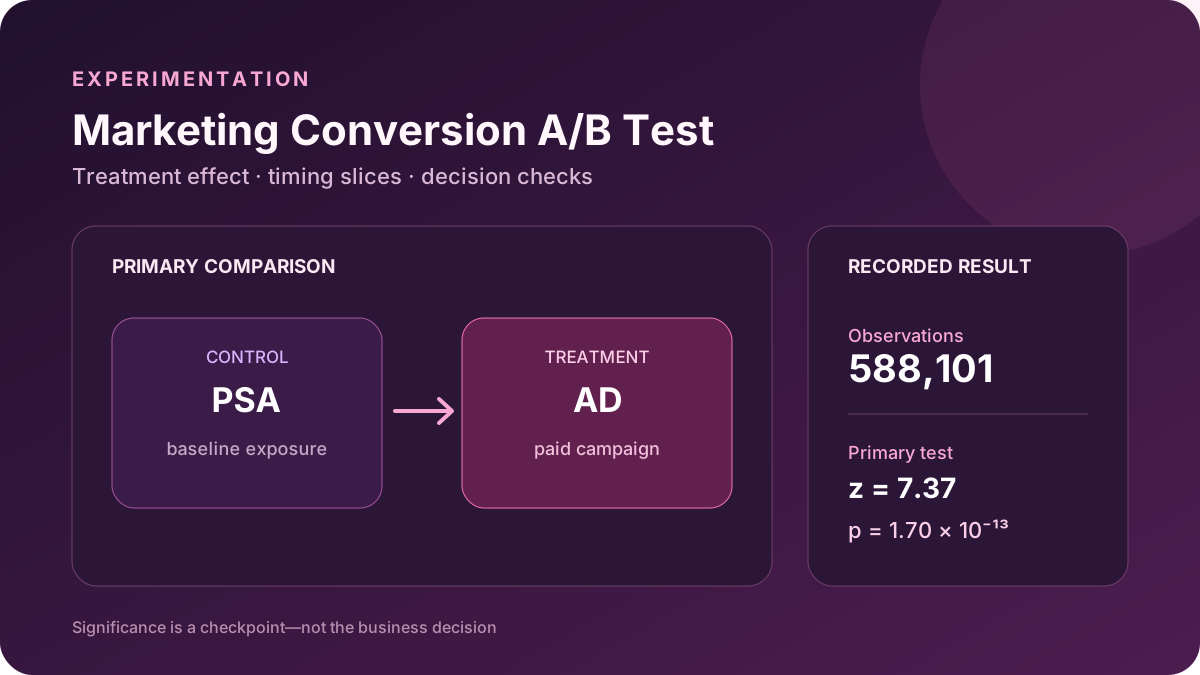
588,101
Users
+0.769 pp
Absolute lift
1.71e-13
p-value
Tech Stack
Description
This project evaluates an anonymized marketing experiment in which the treatment group saw an advertisement and the control group saw a public-service announcement. The goal is to determine whether advertising increases conversion and whether the evidence is ready for a business decision.
The analysis is organized around four stakeholder questions: data readiness, conversion lift, statistical and commercial significance, and exploratory weekday variation. Each answer connects a reproducible statistical method to a concrete decision boundary.
The result supports a real conversion effect, but it does not claim ROI. A rollout decision still requires confirmation of the planned allocation and assignment logs, plus advertising cost, conversion value, and guardrail metrics.
- Validated 588,101 user-level observations and surfaced the 96%/4% allocation risk.
- Estimated a 0.769 percentage-point lift with a 95% confidence interval of 0.595 to 0.943 points.
- Applied a two-proportion z-test, standardized effect size, and practical effect translation.
- Controlled multiple exploratory weekday comparisons with Benjamini–Hochberg correction.
- Separated statistical evidence from ROI and documented the additional data required for rollout.
Project Highlights
Q1. Is the experiment data analysis-ready?
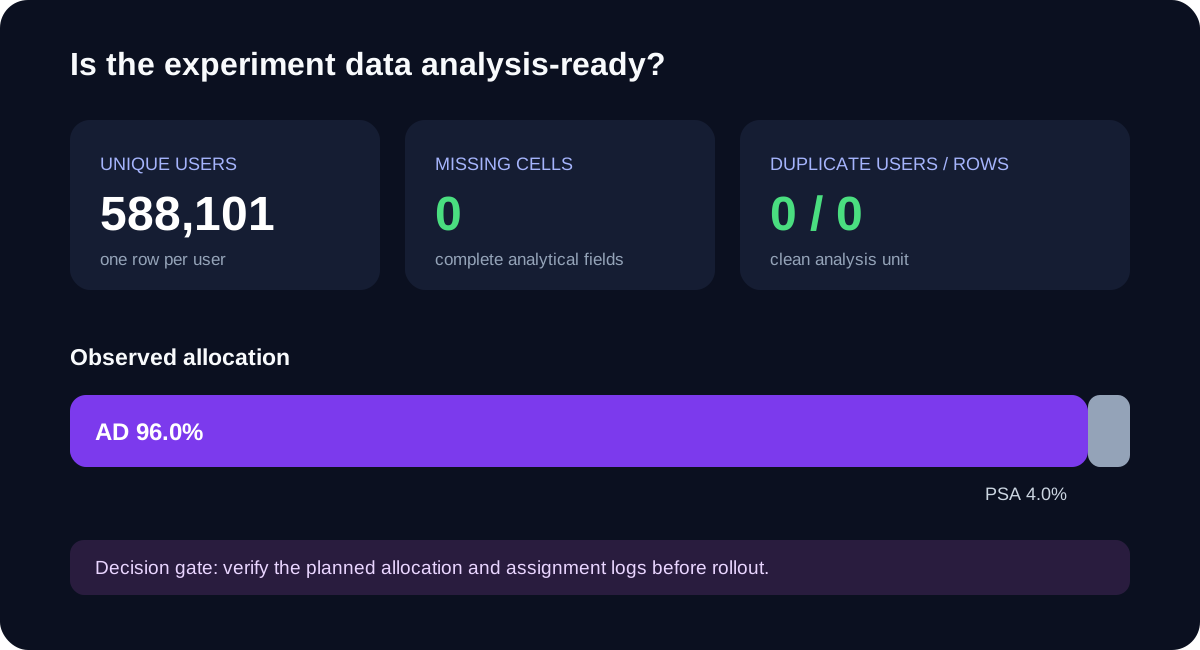
Question: Can the file support a trustworthy user-level comparison? Analysis: I checked the analysis unit, missing values, duplicate users, duplicate rows, outcome validity, and observed group allocation. Finding: All 588,101 users are unique and the analytical fields are complete. Allocation is highly uneven—96.0% ad and 4.0% PSA. Without the planned ratio, this is not enough to declare a sample-ratio mismatch, but assignment logs must be validated before rollout.
Q2. Does advertising increase conversion?
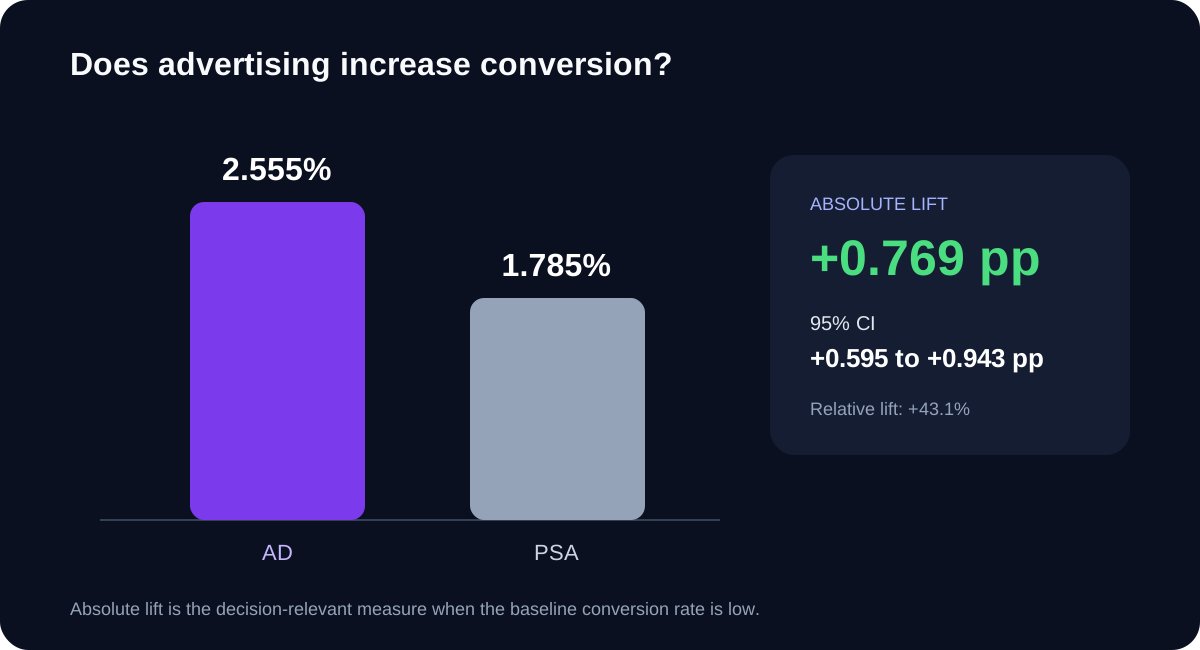
Question: Is conversion higher for users assigned to advertising than for users shown a PSA? Analysis: I estimated both group rates with Wilson confidence intervals, then measured absolute and relative lift. Finding: Advertising converted at 2.555% versus 1.785% for PSA: an absolute lift of 0.769 percentage points and a relative lift of 43.1%. The 95% confidence interval for absolute lift is 0.595 to 0.943 percentage points.
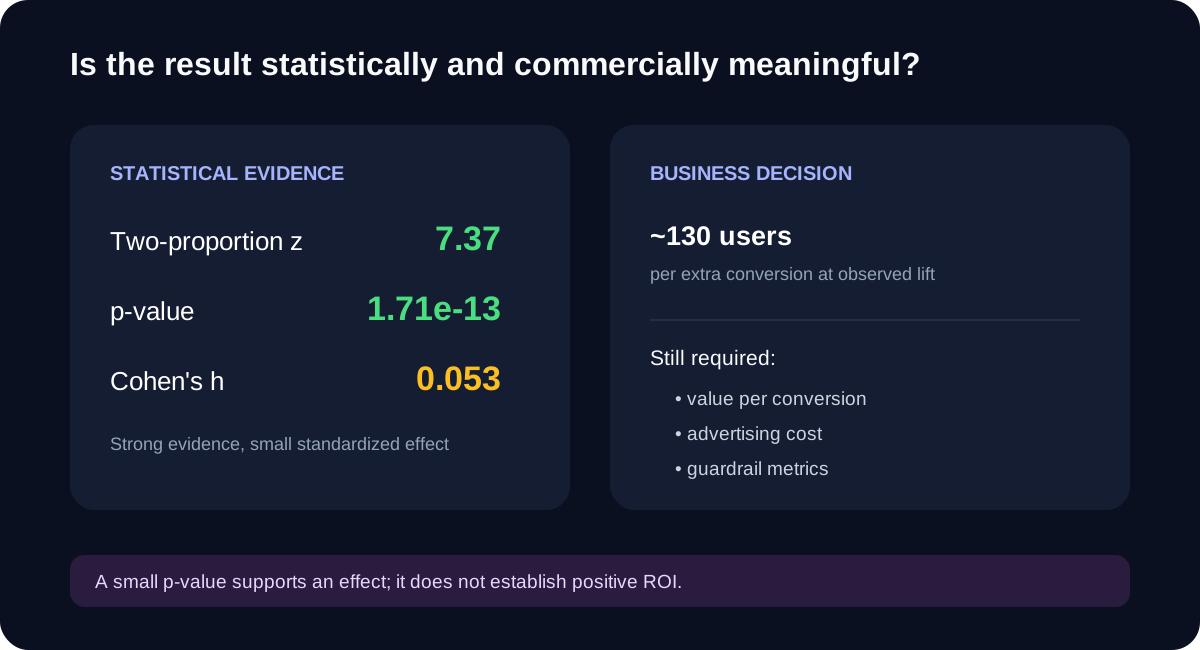
Q3. Is the result statistically and commercially meaningful?
Question: Is the observed difference reliable enough—and valuable enough—to support a business decision? Analysis: A two-sided two-proportion z-test evaluates uncertainty, while Cohen's h and users per extra conversion translate the effect into practical scale. Finding: The evidence is strong (z = 7.37, p = 1.71e-13), but the standardized effect is small (h = 0.053). At the observed lift, approximately 130 additional users correspond to one extra conversion. Positive ROI cannot be claimed without advertising cost and conversion-value data.
Q4. Do results vary by weekday?
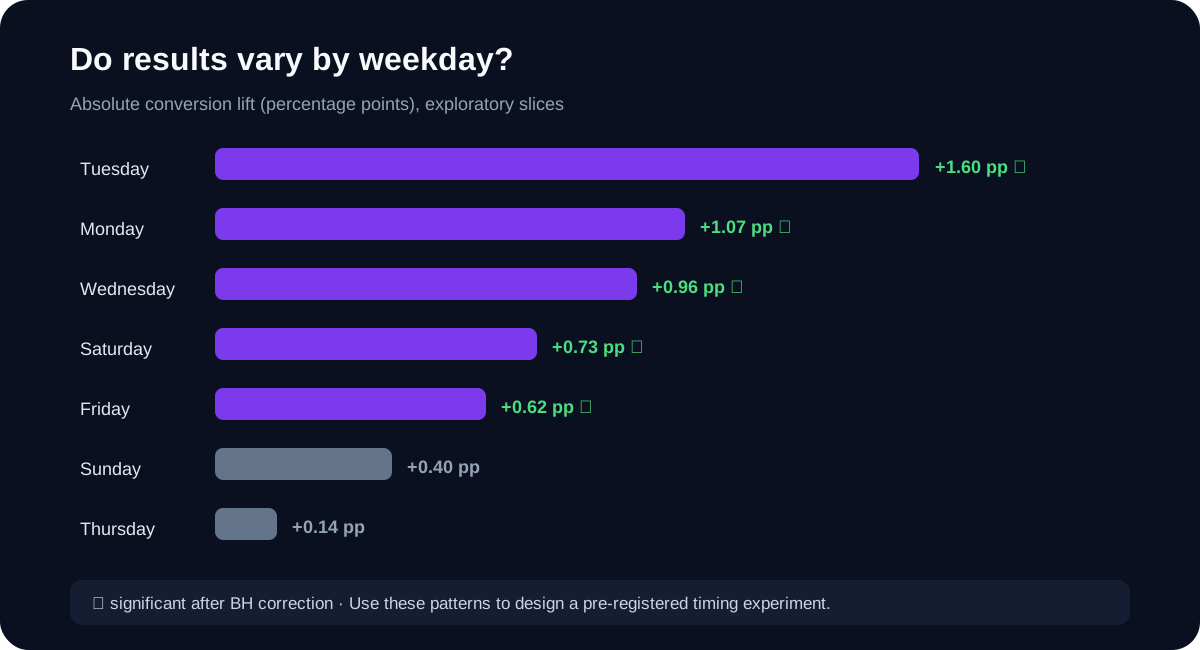
Question: Do weekday slices reveal where a follow-up experiment may be most useful? Analysis: I estimated ad-versus-PSA lift within each weekday and controlled the false-discovery rate with Benjamini–Hochberg correction. Finding: Tuesday has the largest observed lift at 1.60 percentage points. Tuesday, Monday, Wednesday, Saturday, and Friday remain significant after correction; Sunday and Thursday do not. These are exploratory slices, so they guide a pre-registered timing experiment rather than immediate budget reallocation.