Group-Level Training Data Attribution with Exact Shapley Analysis

Tech Stack
Description
This project asks a data-centric question: Which types of training data contribute to shaping model behavior after fine-tuning?
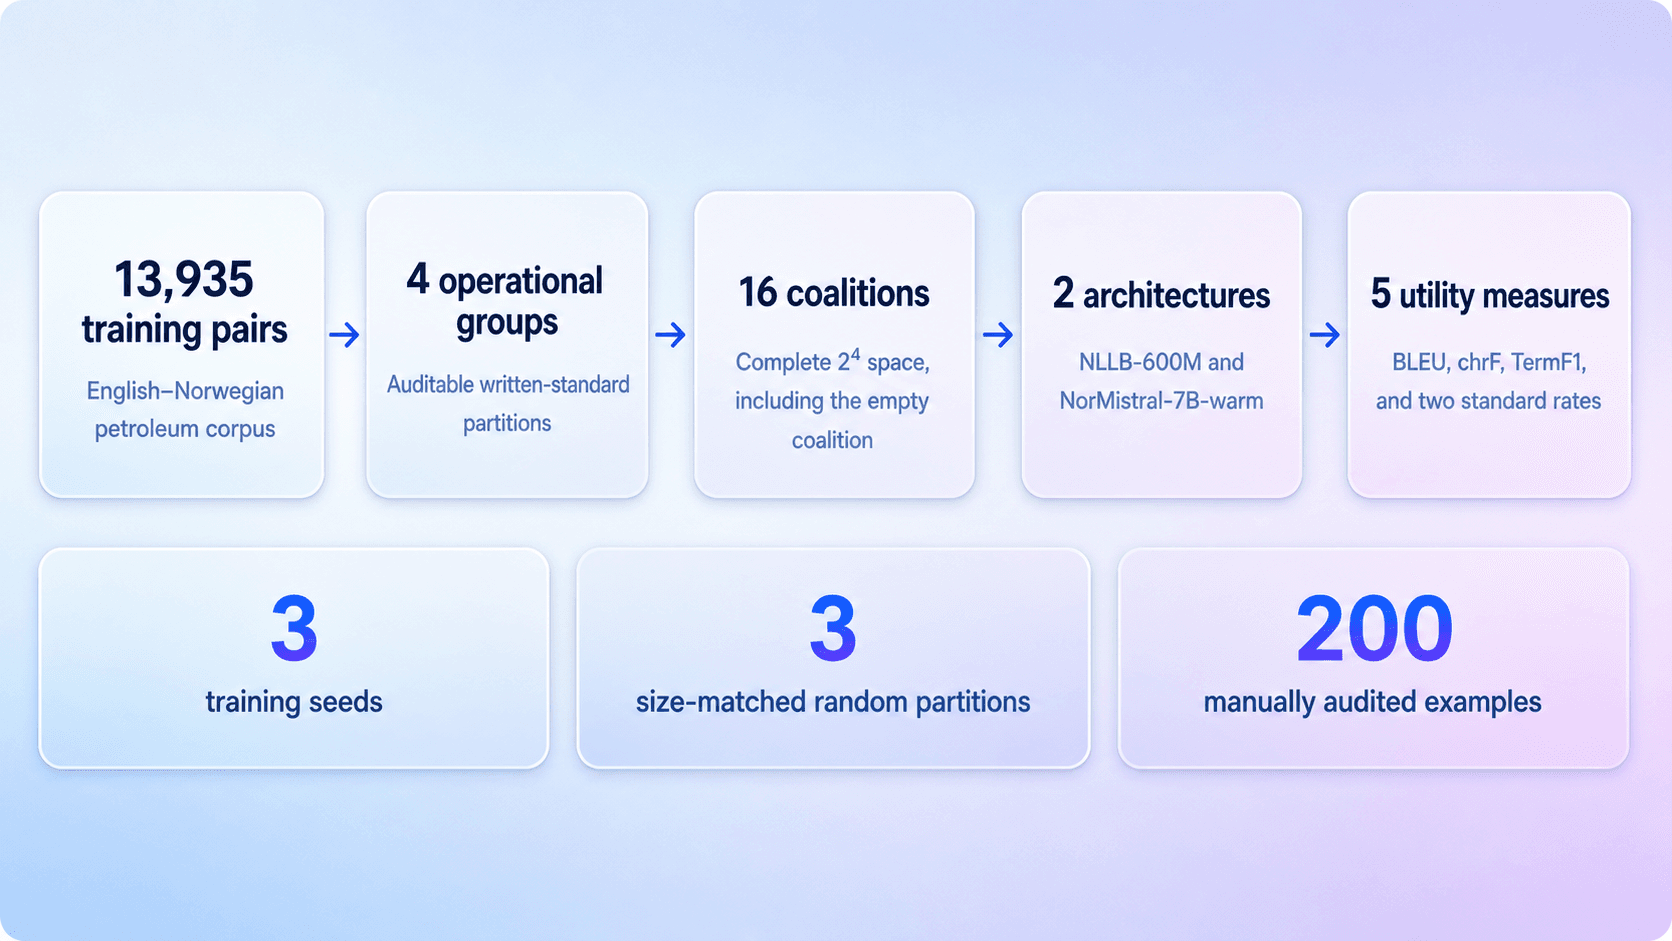
We divide an English–Norwegian petroleum-domain corpus into four groups based on written-standard classifier scores and evaluate all 16 possible combinations using exact Shapley values.
Instead of using a single score for data value, we separately measure translation quality, terminology performance, and written-standard behavior.
As the first author, I led the research and experiments for this project. My contributions included:
- Designed the group-level Shapley attribution framework, including the coalition setup, evaluation metrics, and attribution procedure.
- Led the experiments across NLLB and decoder-only models, including LoRA fine-tuning, coalition training, evaluation, and size-matched random baselines.
- Evaluated the robustness of the attribution results using bootstrap confidence intervals and group-level statistical tests.
- Analyzed how different training groups contribute to translation quality, terminology accuracy, and written-standard behavior.
Research Questions
How do different training-data groups contribute to translation quality, terminology performance, and written-standard behavior?
To what extent can group size alone explain these contributions?
How do these attribution patterns compare across encoder–decoder and decoder-only architectures?
Training-Data Groups
We use SLIDE scores to divide the 13,935 training pairs into four mutually exclusive groups. These groups are used as the units for Shapley attribution.
| Group | Rule | Pairs |
|---|---|---|
| High-Bokmål | sNB ≥ 0.80 and sNN < 0.30 | 10,113 |
| Boundary | sNB ≥ 0.50 and sNN ≥ 0.50 | 880 |
| Nynorsk-like | sNN ≥ 0.50 and sNB < 0.50 | 2,645 |
| Uncertain-other | All remaining cases | 297 |
Here, sNB and sNN are independent SLIDE scores ranging from 0 to 1.
What is in each group?
High-Bokmål
Mostly complete Bokmål sentences about petroleum production, drilling, licences, fields, and geology.
Nynorsk-like
Mostly complete petroleum-domain sentences containing recognizable Nynorsk words and grammatical forms.
Boundary
A mixture of ordinary Bokmål sentences and short items such as contact lines, captions, dates, measurements, and headings.
Uncertain-other
Mostly short metadata-like items: dates, coordinates, company names, headings, links, labels, and text fragments.
These are operational units for Shapley attribution, not gold linguistic categories. The Boundary group mainly reflects classifier uncertainty rather than a clear written-standard category.
All 16 Training-Data Combinations
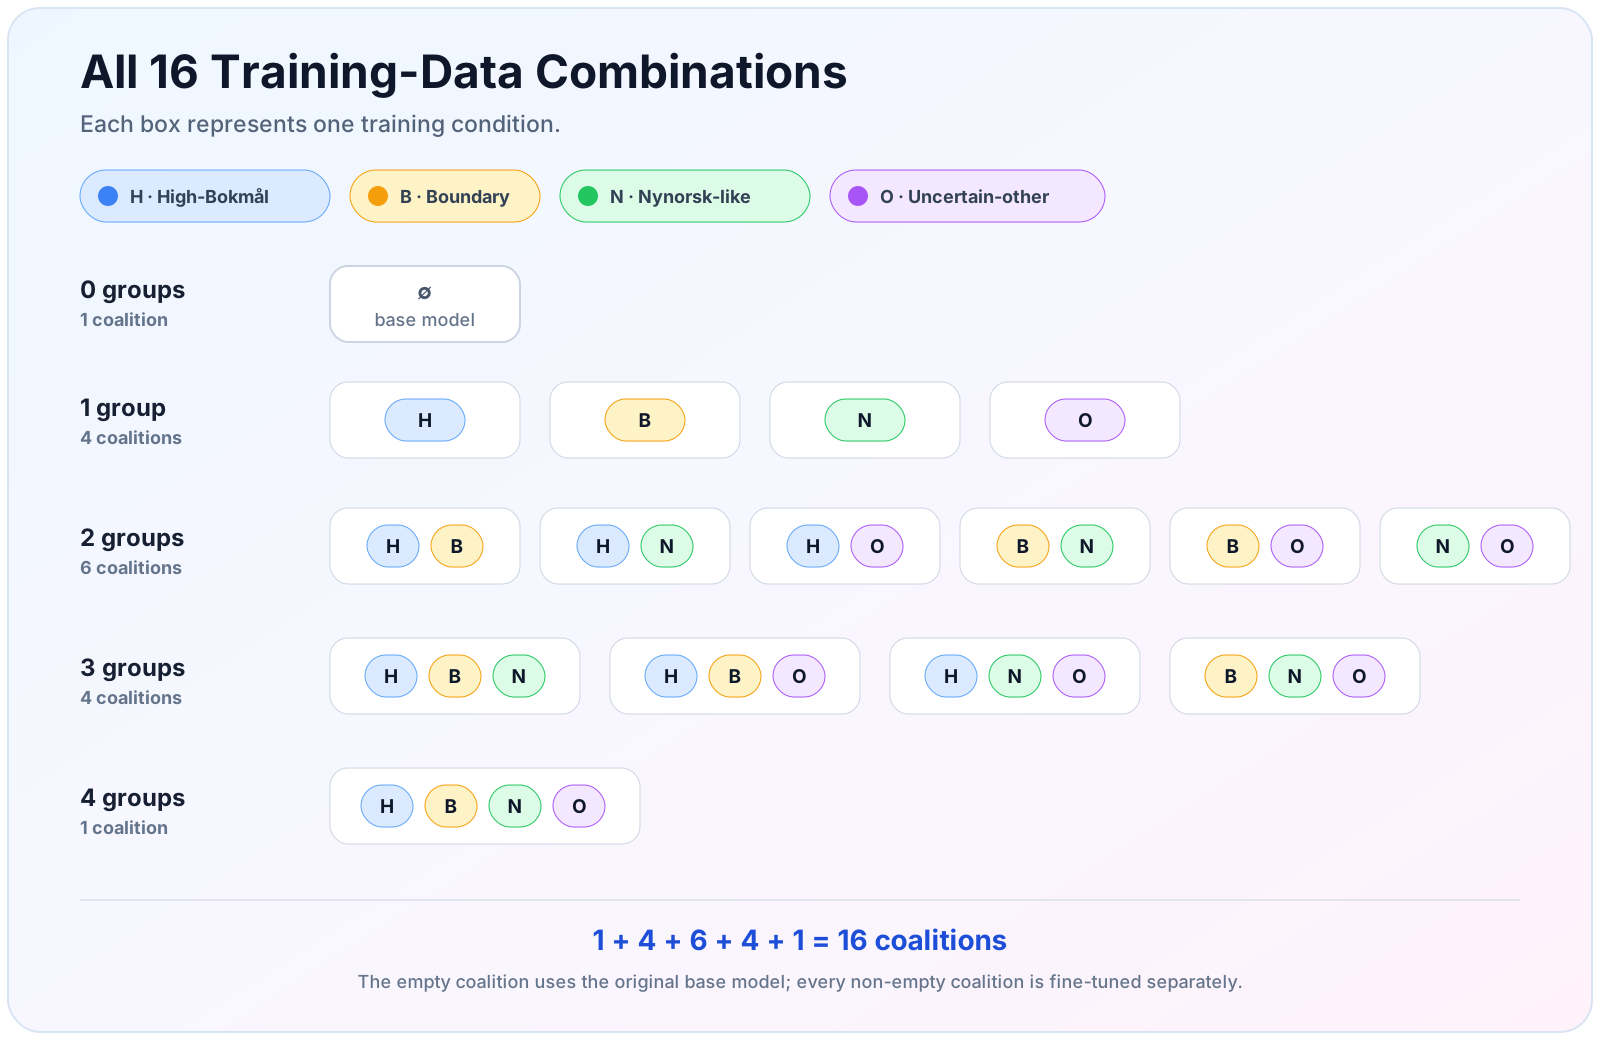
The empty coalition uses the base model; the other 15 are fine-tuned separately.
A coalition is one possible selection of the four groups. Each group is either included or excluded.
24 = 16 coalitions
From Coalition Scores to Shapley Values
For each group g, its exact Shapley value is the weighted average change in metric m when that group is added across every possible coalition.
G = all groups · S = a coalition without g · vm(S) = S’s score on metric m
Exact Group-Level Attribution Overview
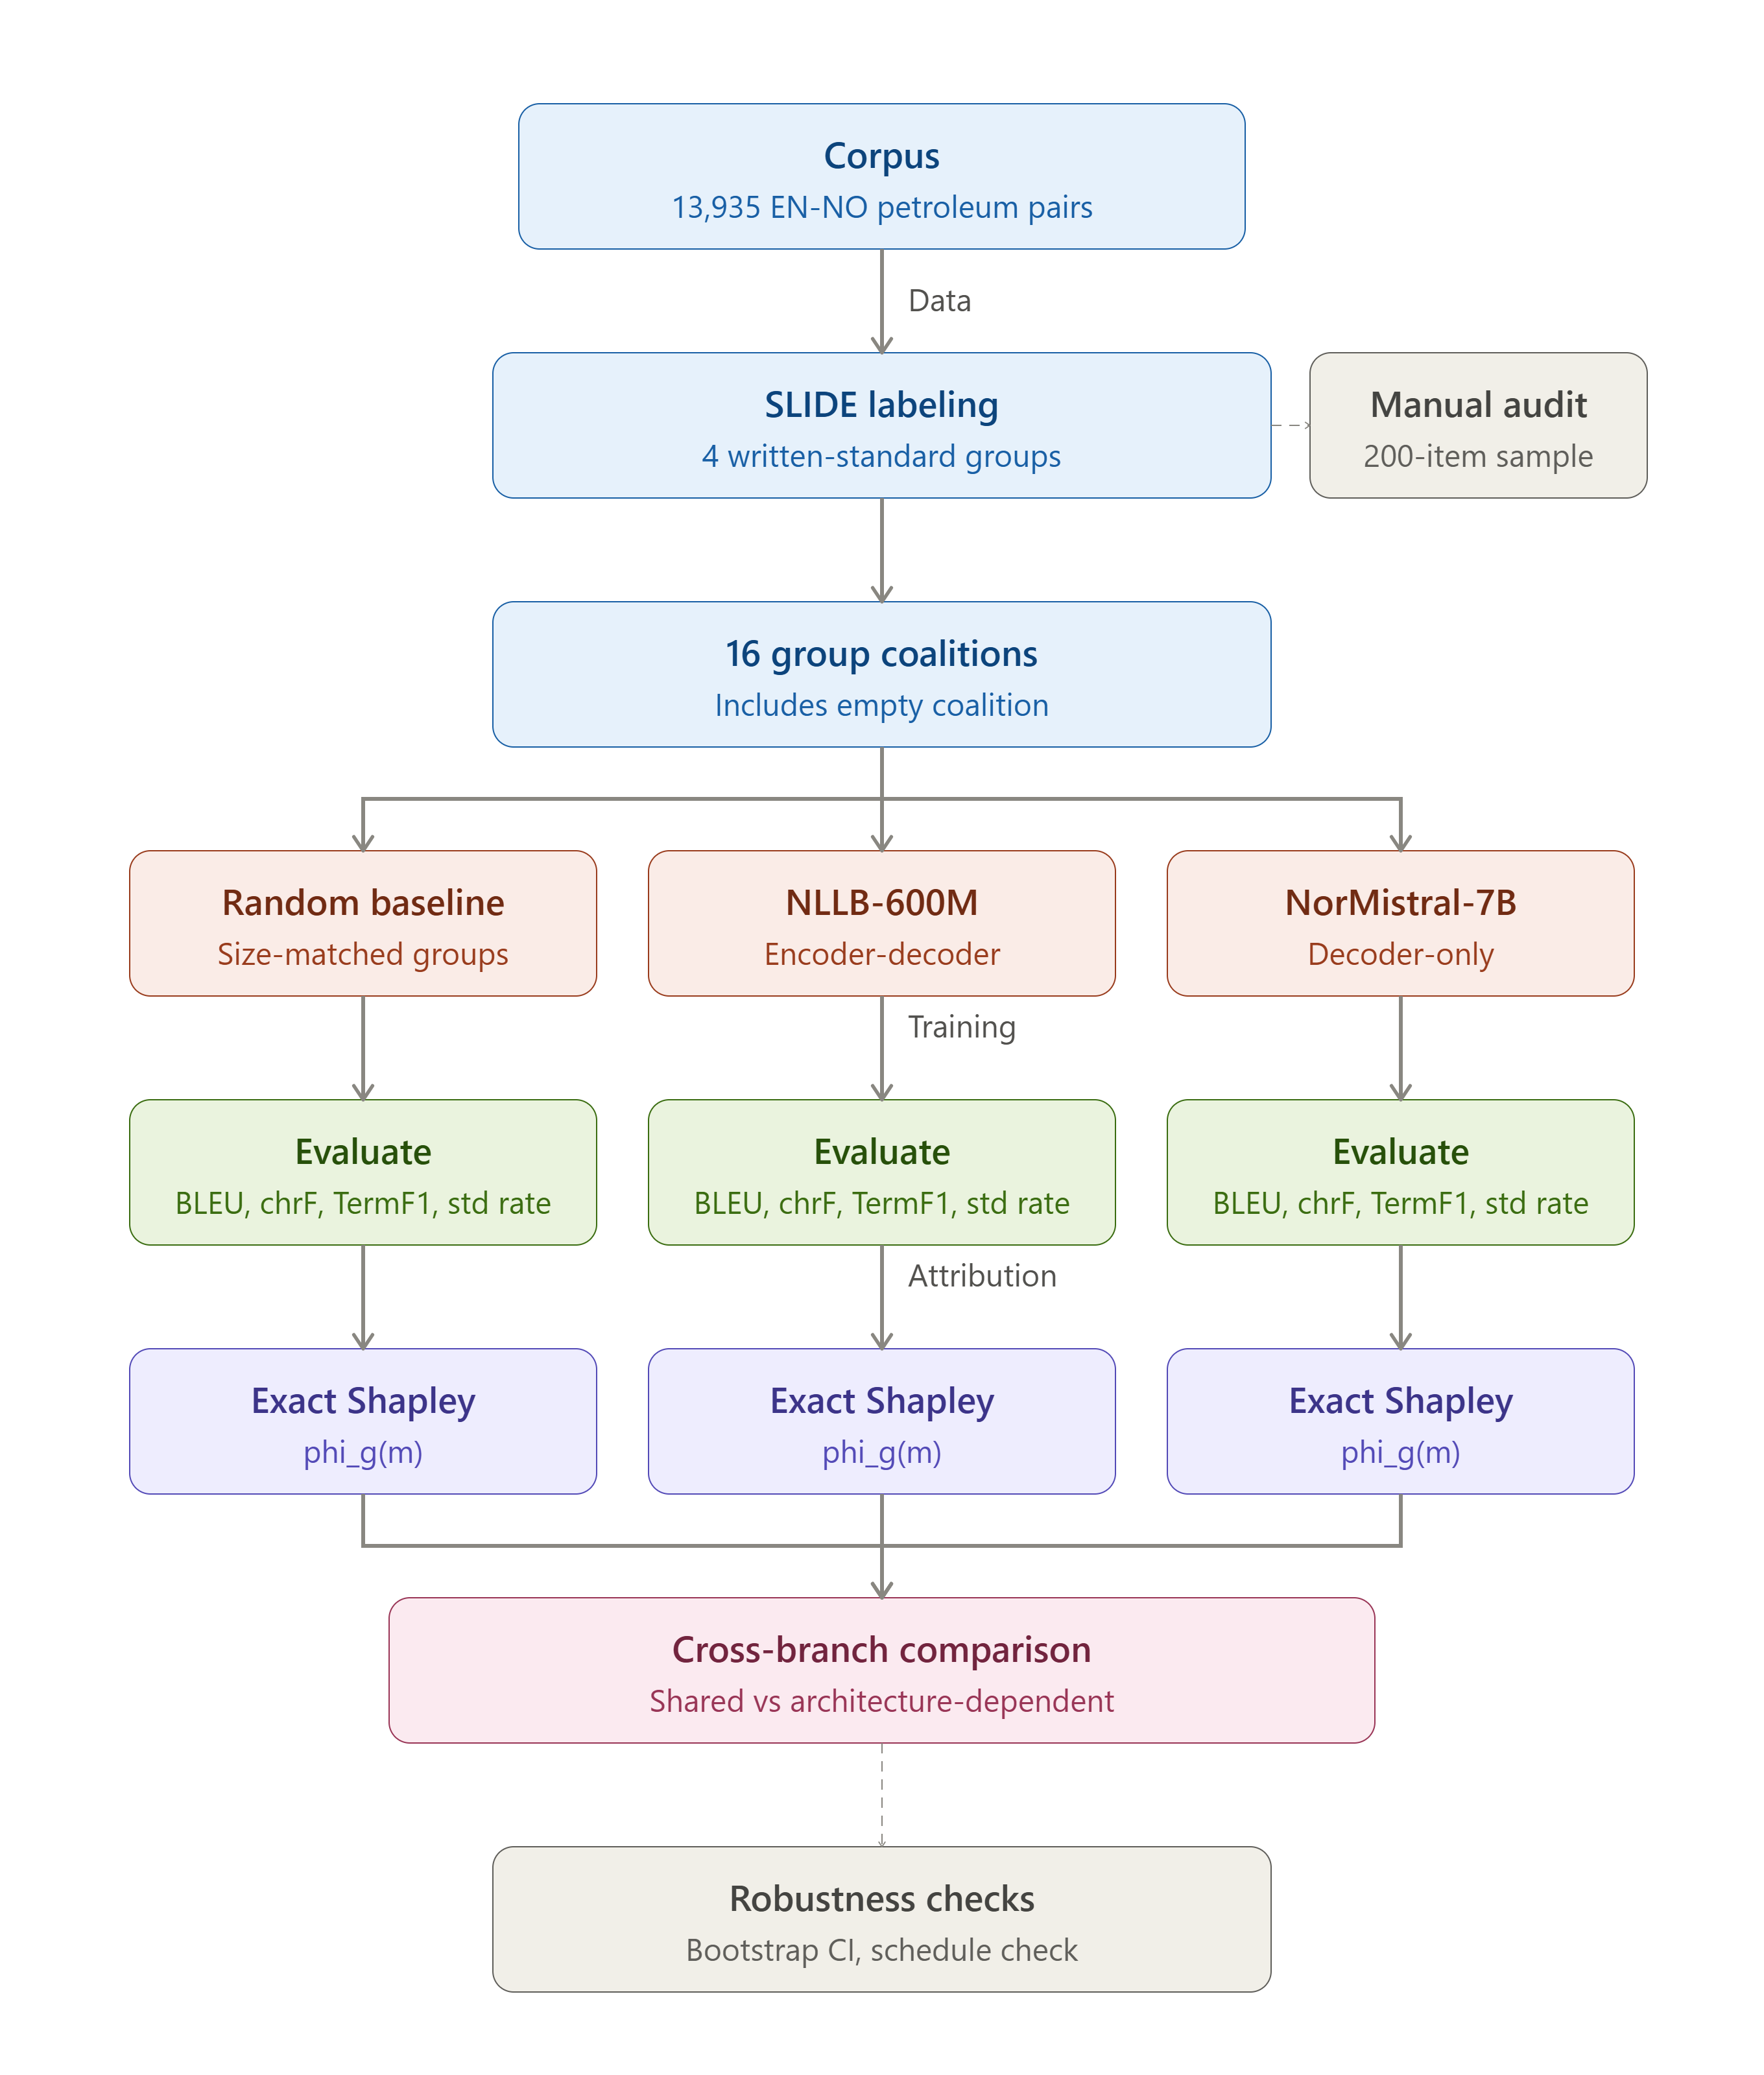
Complete group-level attribution protocol.
We divide 13,935 English–Norwegian petroleum-domain training pairs into four groups using SLIDE scores: high-Bokmål, boundary, Nynorsk-like, and uncertain-other.
We manually check 200 examples , with 50 from each group. Two annotators label the written standard without seeing the SLIDE labels. They agree on 94.5% of the examples (Cohen’s κ = 0.918). The check shows that the boundary group mainly reflects classifier uncertainty rather than a clear linguistic category.
The four groups give 16 possible combinations, including the empty one. We fine-tune every non-empty combination with three seeds, using the original base model for the empty one. We run the experiment with NLLB-600M and repeat it with NorMistral-7B-warm.
We evaluate all combinations on the same 1,742-example test set using BLEU, chrF, terminology F1, high-Bokmål output rate (percentage of outputs classified as high-Bokmål), and Nynorsk-like output rate (percentage of outputs classified as Nynorsk-like). We then calculate exact Shapley values to measure each group’s contribution to each metric.
We also compare the real groups with three random groupings of the same sizes and use test-subset, bootstrap, training-schedule, and threshold checks to assess the results.
RQ1. How do different training-data groups contribute to translation quality, terminology performance, and written-standard behavior?
Exact Shapley values from all 16 NLLB coalitions, averaged over three training seeds. Blue indicates positive contributions; red indicates negative contributions.
Why does Nynorsk-like data have positive value?
The Nynorsk-like group has an overall +3.21 BLEU contribution. But where does this gain come from?
We break the test set down by two factors:
- Reference standard: whether the Norwegian reference is High-Bokmål or Nynorsk-like
- Source overlap: how similar the English test sentence is to the English sentences in the training data
We then examine the Nynorsk-like group’s Shapley contribution within each subset.
High-Bokmål references
Nynorsk-like references
The overall +3.21 BLEU contribution therefore comes from its strong positive effect on Nynorsk-like test examples, while its effect on High-Bokmål examples is negative.
RQ2. To what extent can group size alone explain these contributions?
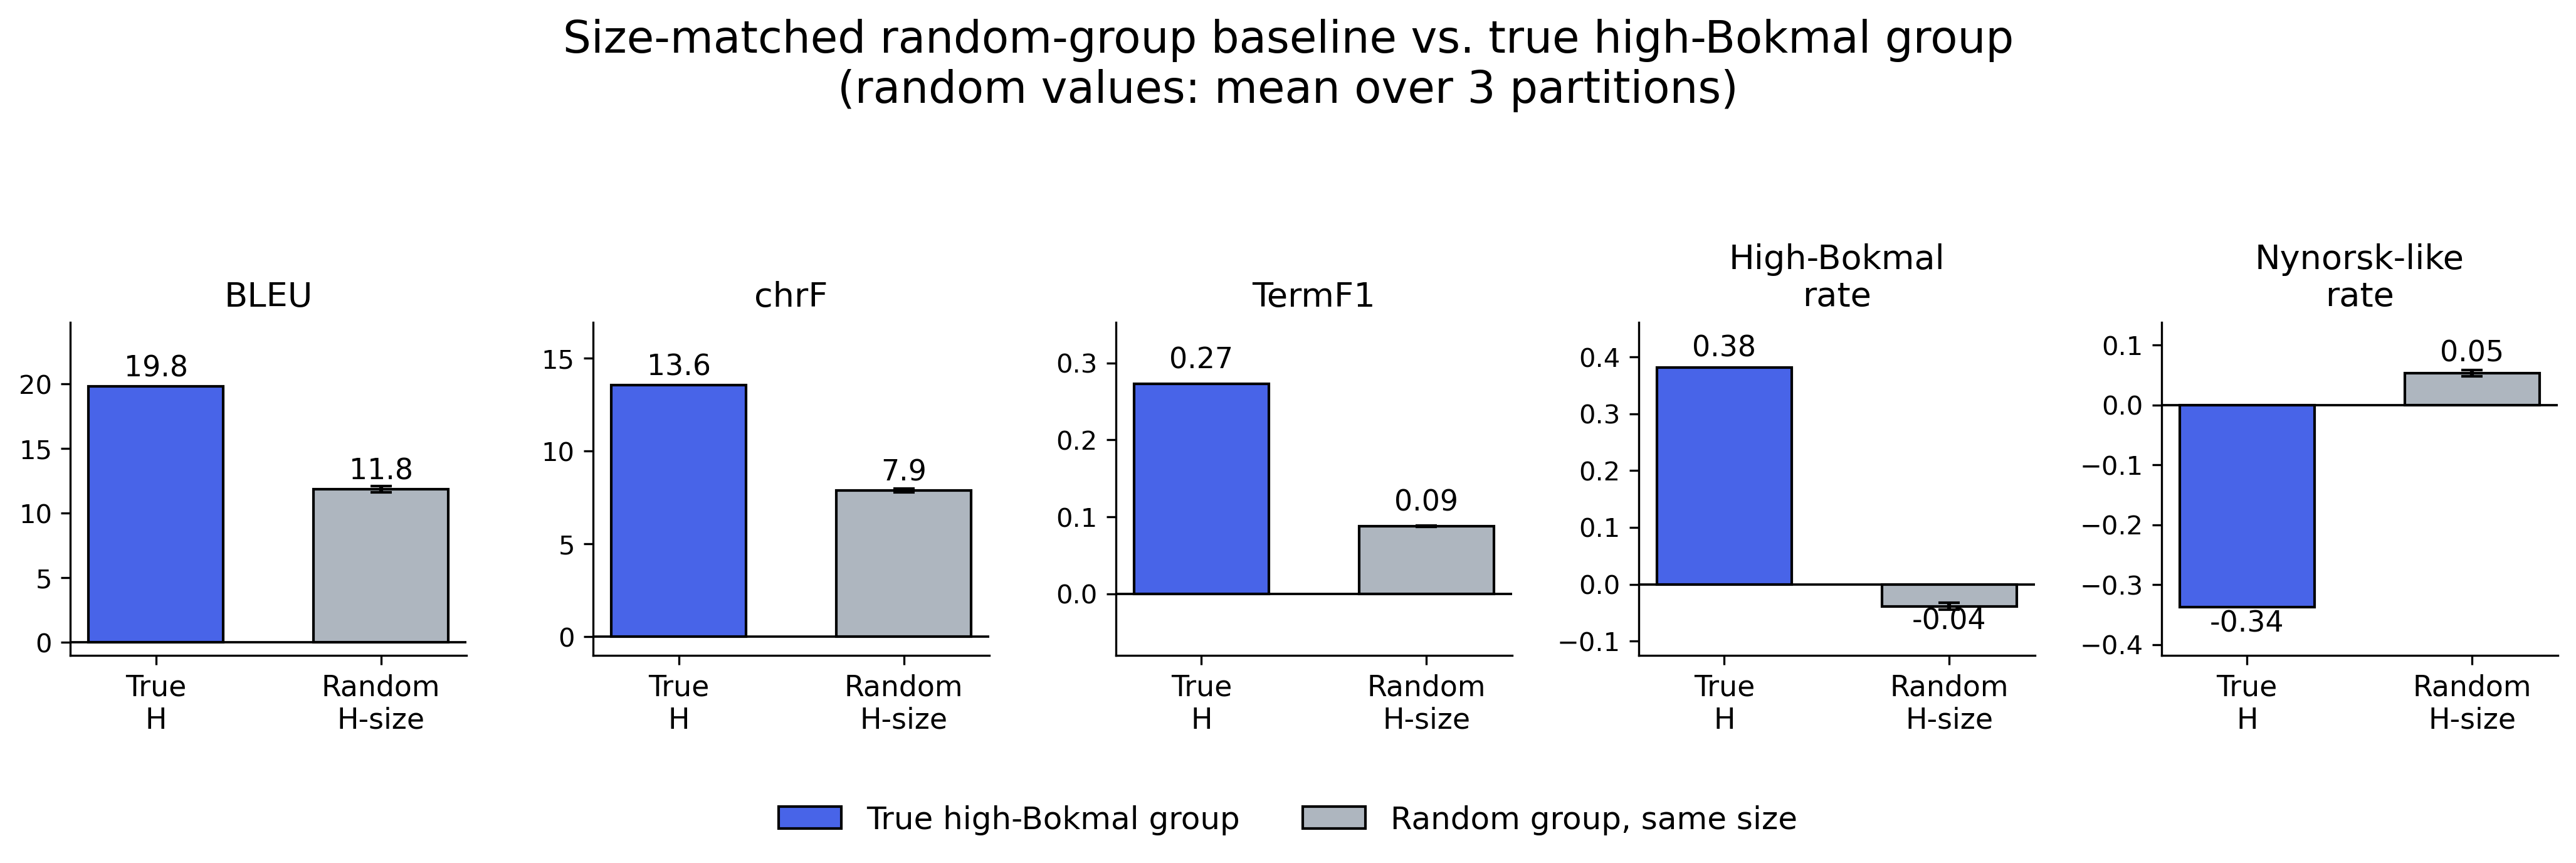
True High-Bokmål group versus random same-size groups.
BLEU
19.83
11.85
chrF
13.56
7.88
TermF1
.273
.088
If group size alone drives the attribution, random groups with the same size should produce similar Shapley values.
We compare the true High-Bokmål group with three random groups of the same size. The random groups contain the same number of training examples, but different examples.
The true High-Bokmål group has substantially higher Shapley values than the random groups across translation quality and terminology. Thus, simply having the same amount of training data does not reproduce the contribution of the true group.
RQ3. How do these attribution patterns compare across encoder–decoder and decoder-only architectures?
We compare the group-level Shapley effects in NLLB-600M (encoder–decoder) and NorMistral-7B-warm (decoder-only). The table shows representative results for translation quality, terminology, and written-standard behavior.
| Attribution effect | NLLB | NorMistral |
|---|---|---|
| High-Bokmål → BLEU | +19.83 | +15.31 |
| High-Bokmål → TermF1 | +0.273 | +0.148 |
| High-Bokmål → Bokmål output | +38.1 pp | +39.1 pp |
| Nynorsk-like → BLEU | +3.21 | +1.56 |
| Nynorsk-like → TermF1 | −0.028 | −0.092 |
| Nynorsk-like → Bokmål output | −45.9 pp | −45.9 pp |
| Nynorsk-like → Nynorsk-like output | +46.9 pp | +47.8 pp |
| Uncertain-other → BLEU | +0.61 | −1.30 |
Output-rate values are Shapley contributions to output proportions, reported in percentage points (pp).
The main effects are similar in both architectures. High-Bokmål data makes the largest positive contribution to BLEU and also increases Bokmål output. Nynorsk-like data shows the opposite written-standard effect: it reduces Bokmål output and increases Nynorsk-like output in both models.
Some smaller effects differ between the models. For example, Uncertain-other contributes +0.61 BLEU in NLLB but −1.30 BLEU in NorMistral.
Robustness and Data Audit
1,000
sentence-level bootstrap samples
3
training seeds per architecture
200
manually audited examples
94.5%
annotator agreement
Cohen’s κ = 0.918
We test the reliability of the attribution results using multiple training seeds, sentence-level bootstrap resampling, an alternative training schedule, and manual group auditing.
The main effects remain stable under test-set resampling. High-Bokmål has a BLEU Shapley value of 19.83 (95% bootstrap CI: [18.89, 20.76]), while the Nynorsk-like contribution to High-Bokmål output is −0.459 (95% bootstrap CI: [−0.471, −0.447]).
A seed-42 NLLB rerun with proportional warmup and epoch-level evaluation preserves the BLEU and chrF contribution signs and group rankings. Manual auditing shows high annotator agreement and indicates that the boundary group should be treated as a classifier-boundary group rather than a stable linguistic category.
Final takeaway
Training-data value is not fixed. It depends on the behavior, evaluation data, and model architecture.