Customer Segmentation: Which Groups Behave Differently?

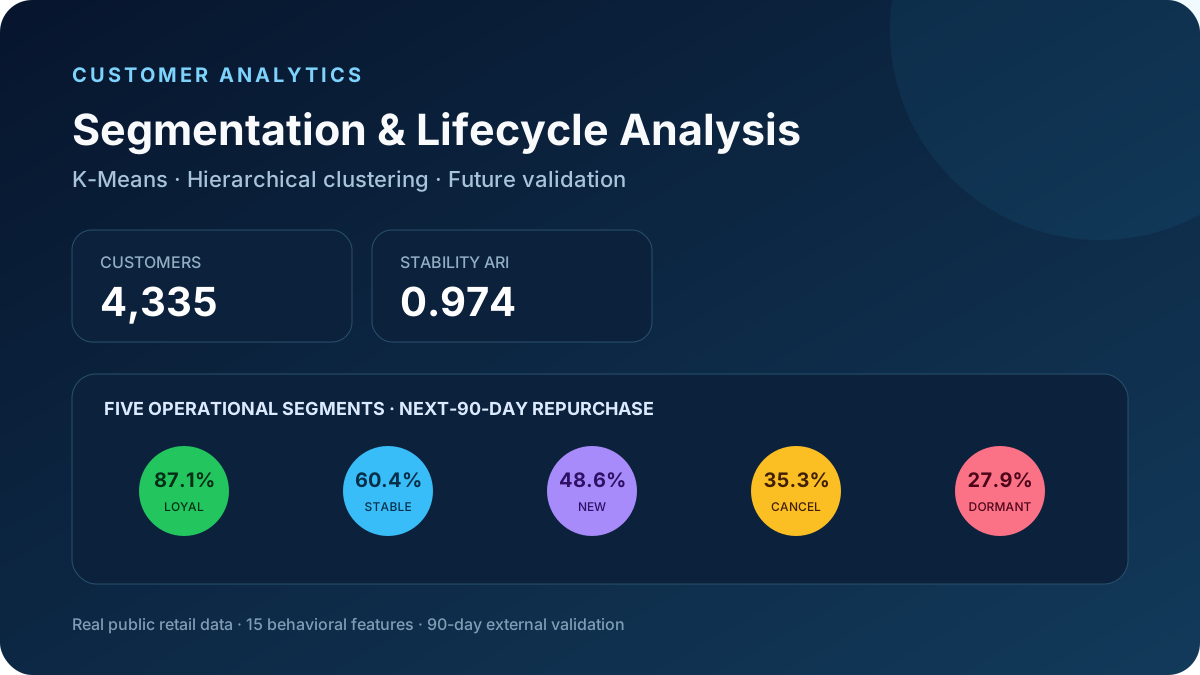
4,335
Customers
0.974
Stability ARI
87.1%
Top repurchase
Tech Stack
Description
This project turns real public retail transactions into an operational customer segmentation workflow. It directly demonstrates the K-Means and hierarchical-clustering methodology highlighted in my data-analyst experience.
The analysis goes beyond a static RFM table. It defines a point-in-time feature window, compares four clustering families, tests sensitivity to small feature perturbations, and reserves the following 90 days for external business validation.
The public dataset has 4,335 eligible customers at the selected cutoff. It demonstrates the same methodology as my professional work, but it is not presented as the 150,000+ sample dataset described in my resume. Segment membership is predictive and descriptive—not evidence that a marketing intervention will cause retention.
- Audited 1,067,371 transaction lines and constructed 15 leakage-safe customer features.
- Selected five K-Means segments with 0.974 perturbation-stability ARI and a 9.5% minimum segment share.
- Compared K-Means, Ward hierarchical clustering, Gaussian Mixture, and HDBSCAN on identical inputs.
- Reported the modest 0.225 silhouette score instead of overstating natural cluster separation.
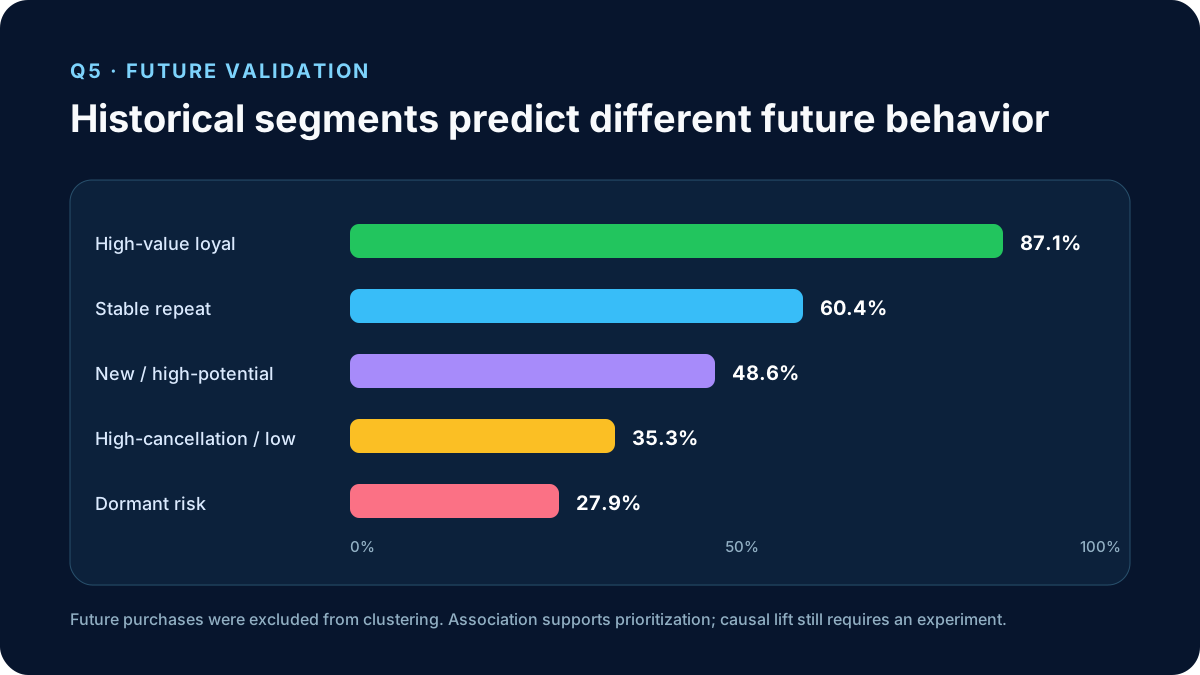
- Validated segment usefulness with untouched future behavior: 87.1% versus 27.9% repurchase at the two extremes.
Project Highlights
Q1. Can the transactions support reliable customer segmentation?
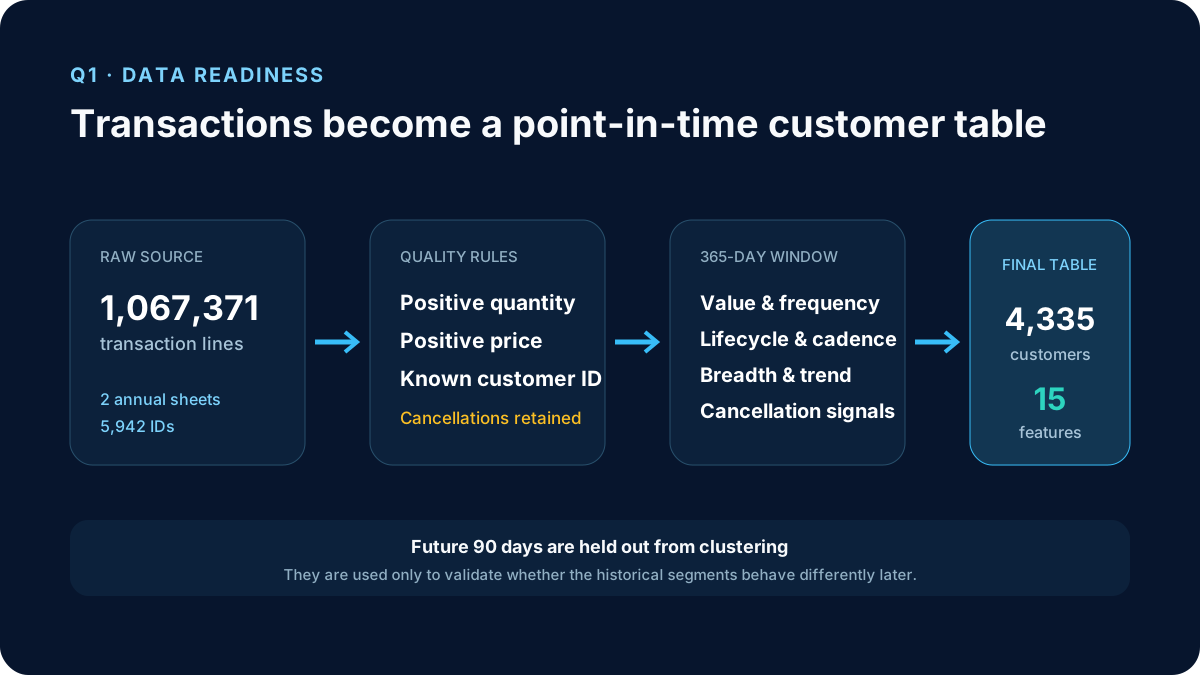
Question: Can two years of transaction history be converted into a trustworthy customer-level analysis table? Analysis: I audited 1,067,371 transaction lines, separated successful purchases from cancellations, and used a fixed 365-day observation window ending on 1 September 2011. Customers needed at least one successful purchase during that window. Fifteen features capture value, frequency, lifecycle, purchase cadence, product breadth, recent trend, and cancellation behavior. Finding: The final clustering population contains 4,335 customers. Missing purchase intervals are treated as expected single-order behavior, while extreme values are clipped rather than deleting customers. The following 90 days remain completely outside the clustering features.
Q2. How many customer segments are useful?
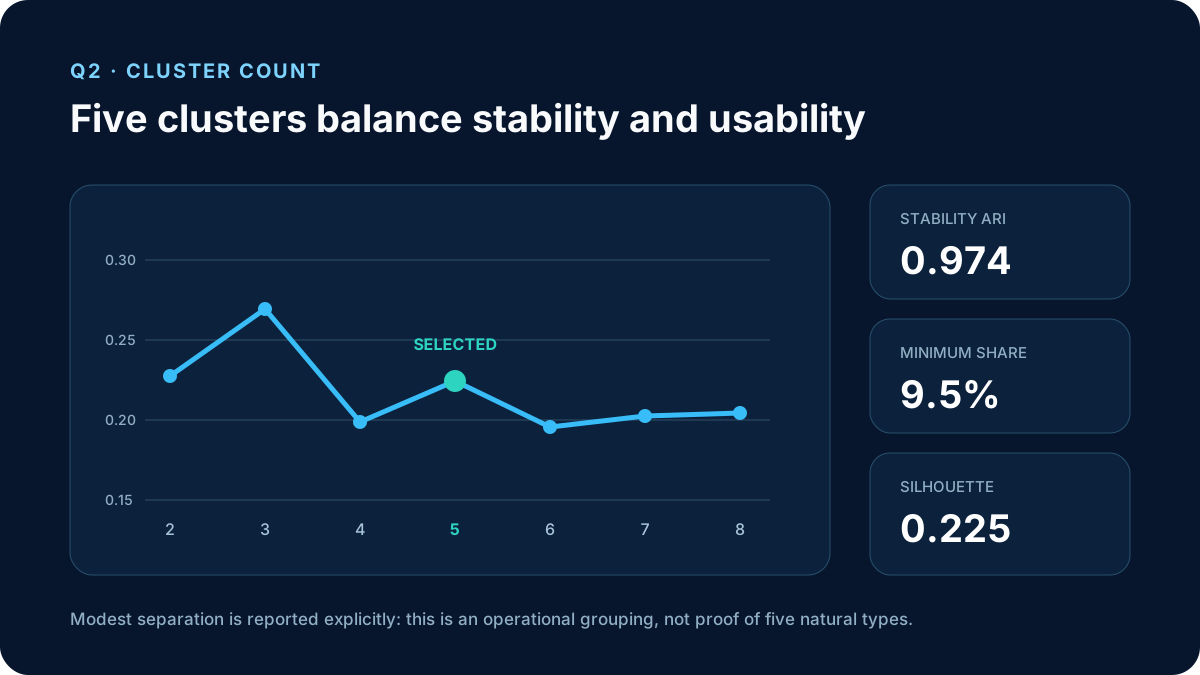
Question: Which cluster count balances statistical quality, stability, and operational usability? Analysis: I evaluated K-Means solutions from two to eight clusters using silhouette, Davies–Bouldin, Calinski–Harabasz, perturbation stability, and minimum segment share. The operational choice was restricted to four to six clusters with no segment smaller than 3%. Finding: The five-cluster solution provides the best combined rank within the operational range. Its perturbation stability ARI is 0.974 and its smallest segment contains 9.5% of customers. The silhouette score is only 0.225, so the segments are presented as a stable operational simplification—not five strongly separated natural customer types.
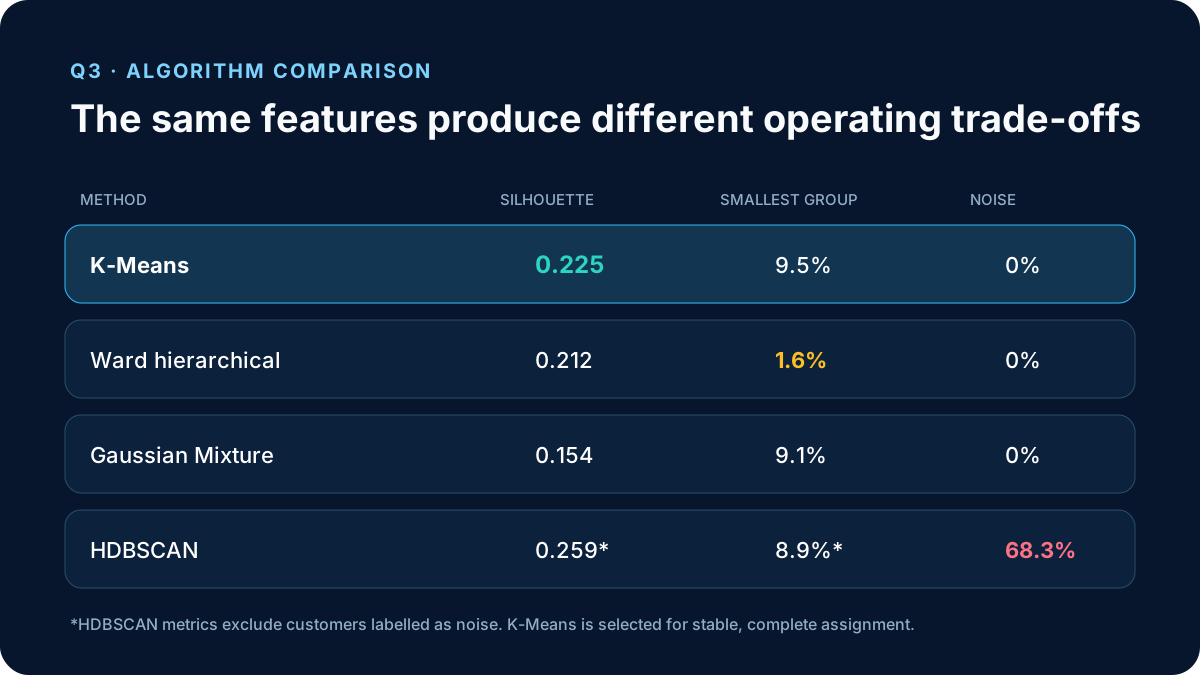
Q3. Does another clustering method produce a better operational solution?
Question: How do K-Means, Ward hierarchical clustering, Gaussian Mixture, and HDBSCAN compare on the same features? Analysis: Every algorithm uses the same clipped, transformed, imputed, and standardized feature matrix. I compare separation, cluster balance, and noise share, then use adjusted Rand index to measure agreement between K-Means and Ward labels. Finding: K-Means retains five operationally sized segments. Ward creates a 1.6% micro-segment, while HDBSCAN labels 68.3% of customers as noise. K-Means and Ward have moderate agreement (ARI 0.532). K-Means is selected because it is stable, reproducible, and can assign future customers to the nearest center; hierarchical clustering remains a structural cross-check.
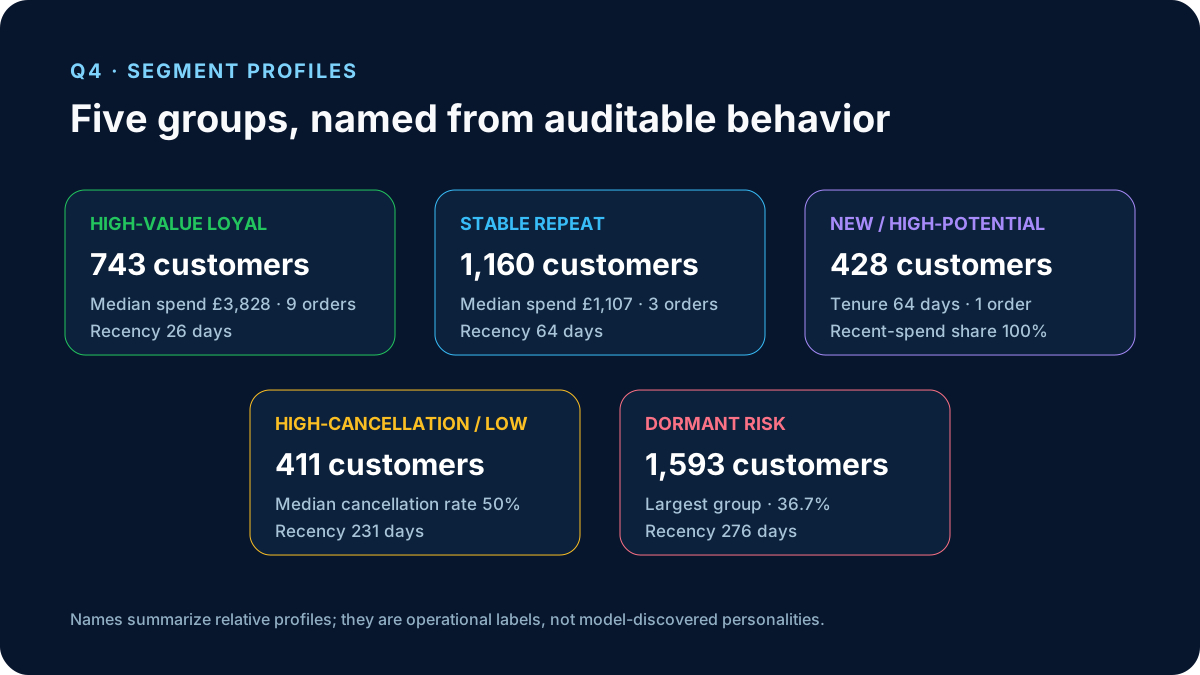
Q4. Who are the five customer groups?
Question: Do the cluster profiles translate into distinct, auditable customer strategies? Analysis: I profile each cluster in original business units and assign names through reproducible relative rules. Names summarize value, recency, tenure, recent activity, and cancellation behavior; they are operational labels rather than model-discovered personalities. Finding: The five groups are high-value loyal, stable repeat, new / high-potential, high-cancellation / low-engagement, and dormant risk. High-value loyal customers have median 365-day spend of GBP 3,828 and nine orders. Dormant-risk customers represent the largest group at 36.7%, while the high-cancellation group has a 50% median cancellation-invoice rate and should be investigated before promotional outreach.
Q5. Do the segments predict different future behavior?
Question: Do customers in different historical clusters behave differently during the following 90 days? Analysis: Future purchases were excluded from clustering and used only for external validation. I compare 90-day repurchase rates, order counts, spend, and Wilson confidence intervals across the five segments. Finding: High-value loyal customers repurchase at 87.1%, compared with 60.4% for stable repeat, 48.6% for new / high-potential, 35.3% for high-cancellation / low-engagement, and 27.9% for dormant-risk customers. This supports prioritization, but it does not prove that coupons or outreach will cause retention; that requires a randomized experiment with margin and treatment-cost data.