90-Day Purchase Inactivity: Who Should Retention Prioritize?

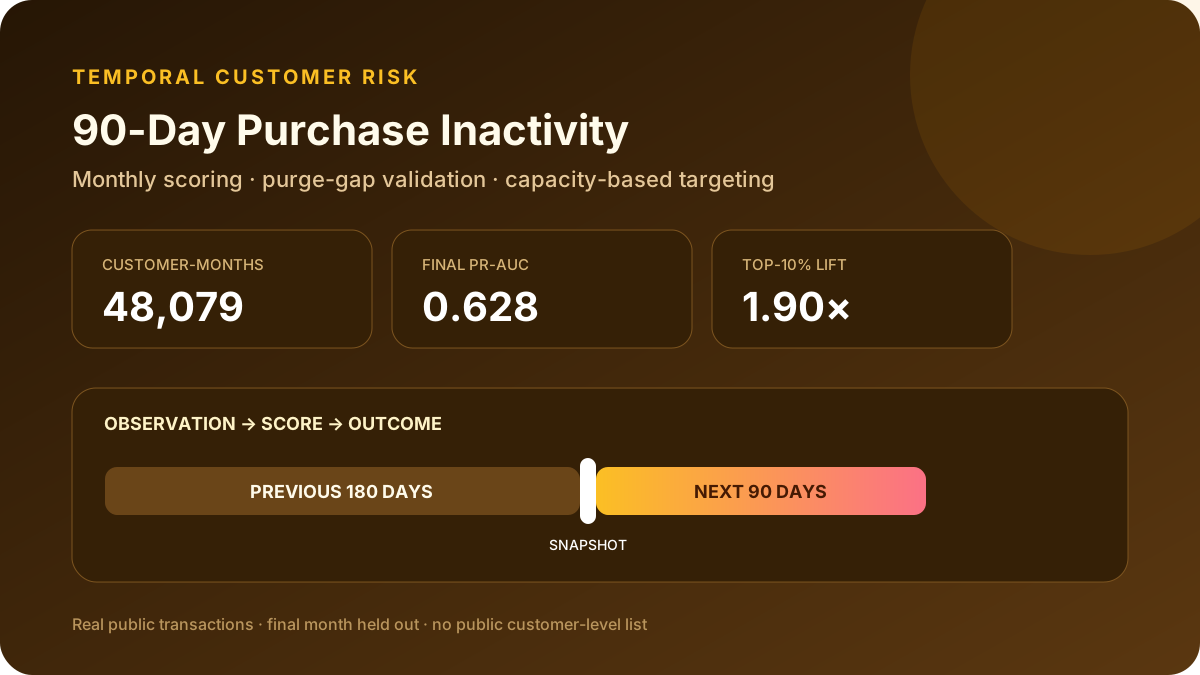
48,079
Customer-months
0.628
Final PR-AUC
1.90×
Top-10% lift
Tech Stack
Description
This project asks a precise retention question: among customers who purchased during the previous 180 days, who is most likely to make no successful purchase during the next 90 days? It turns real public retail transactions into a monthly scoring workflow rather than relying on a pre-labelled practice churn file.
The evaluation is deliberately temporal. Training labels mature before each validation point through a 90-day purge gap, and the newest month is held out until the model family is selected. The gap between rolling validation and the final month remains visible as evidence of distribution change.
Risk scores support a capacity-constrained candidate list, not a causal retention claim. The public data do not contain campaign cost, margin, randomized outreach, or permanent customer-departure status, so intervention lift and ROI remain outside the evidence boundary.
- Constructed 48,079 customer-month observations across 16 snapshots from 1,067,371 real transaction lines.
- Engineered 23 recency, frequency, value, cadence, trend, product-breadth, country, and cancellation features.
- Compared four classifiers across three purge-gap rolling validation folds using PR-AUC as the primary metric.
- Preserved the drop from 0.744 validation PR-AUC to 0.628 on the untouched final month.
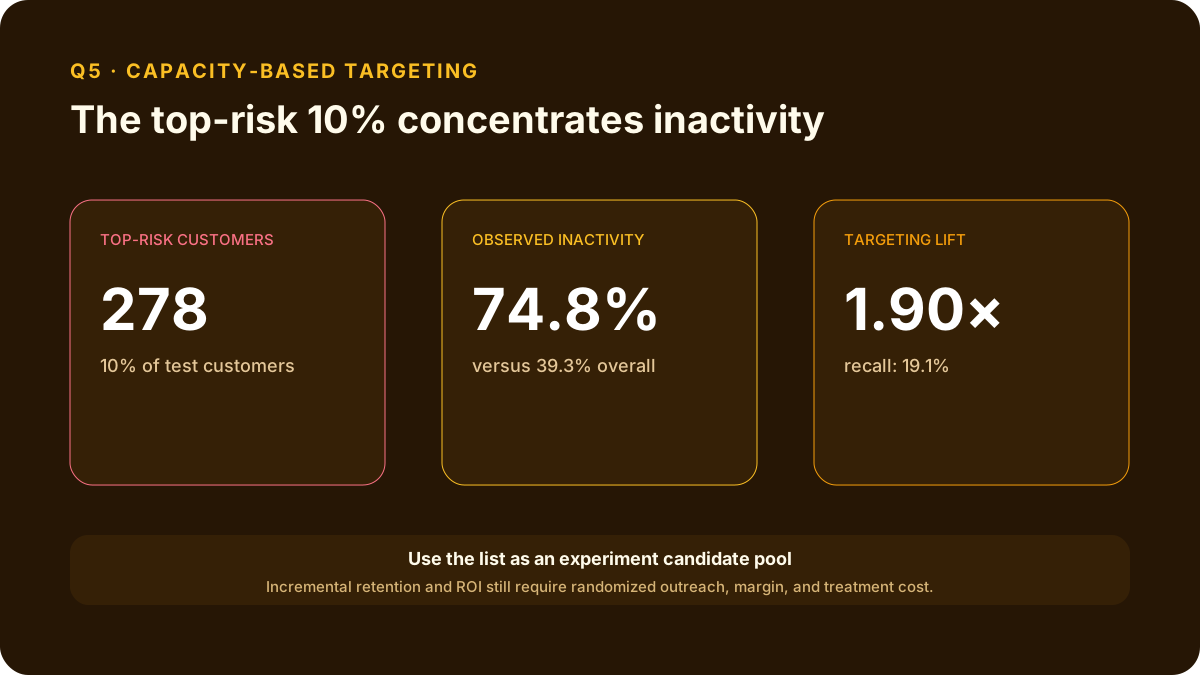
- Translated scores into a Top-10% operating decision: 74.8% precision, 19.1% recall, and 1.90× lift.
Project Highlights
Q1. What exactly is the model predicting?
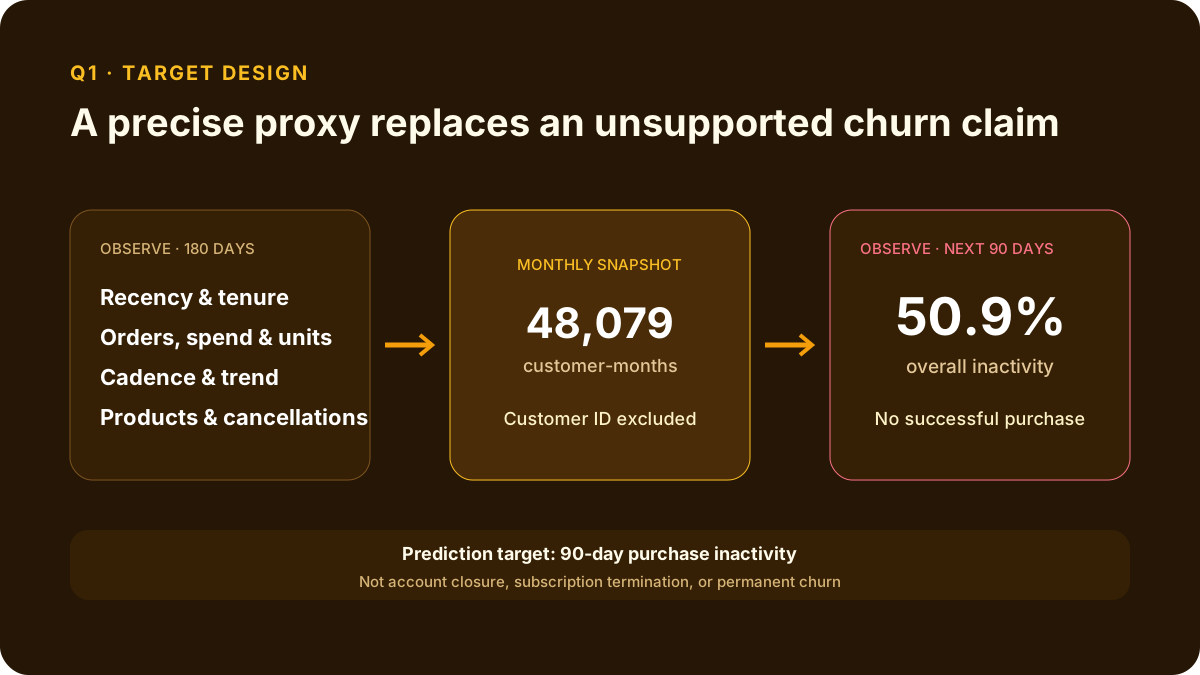
Question: Can transaction history define a reproducible customer-risk target without pretending to observe permanent churn? Analysis: At the start of each month, I identify customers who purchased during the previous 180 days. Features use only that historical window. The target is one when the customer makes no successful purchase during the following 90 days. Customer ID never enters the model. Finding: Sixteen monthly snapshots produce 48,079 customer-month observations with an overall inactivity rate of 50.9%. The target is explicitly named 90-day purchase inactivity—not permanent churn—because the data contain no account closure or customer-departure field.
Q2. How does the validation prevent future leakage?
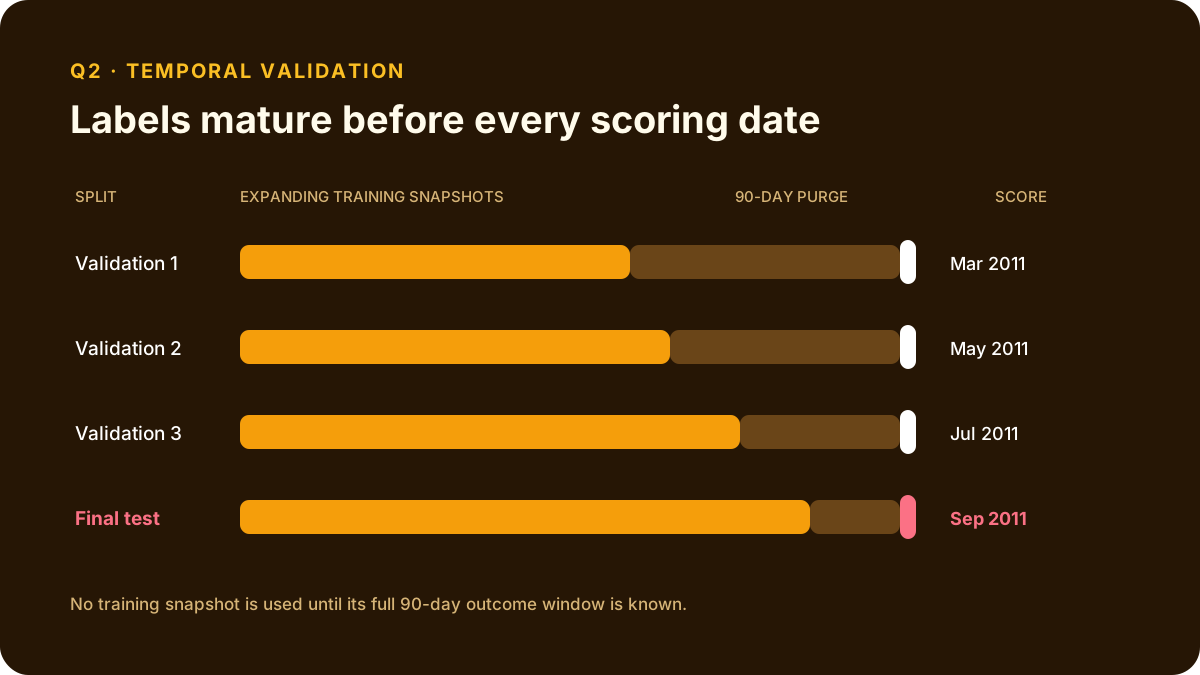
Question: Can a model be evaluated at a future scoring date without allowing training labels to overlap that date? Analysis: The workflow uses three expanding-window validation folds. Every training snapshot is separated from its validation month by at least 90 days, so the full inactivity label is already known before the prediction point. September 2011 remains untouched until after model selection. Finding: The rolling folds validate March, May, and July 2011; the final test scores September 2011 using training snapshots only through June. This purge gap is stricter than a random or ordinary chronological split and avoids label-window leakage.
Q3. Which classifier is most reliable over time?
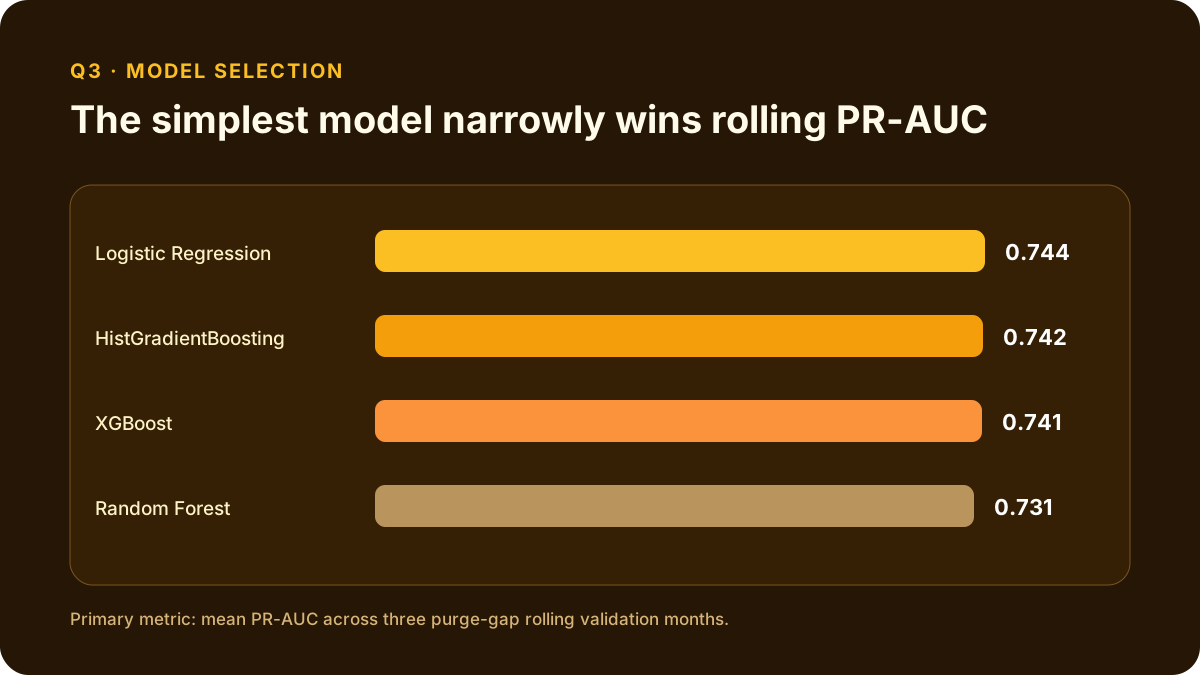
Question: Which model ranks future inactivity most consistently across the three rolling validation months? Analysis: Logistic Regression, Random Forest, HistGradientBoosting, and XGBoost use the same 23 behavioral features and temporal folds. Model selection uses mean PR-AUC, with ROC-AUC, F1, and Brier score retained as diagnostics. Finding: Logistic Regression ranks first with mean PR-AUC 0.744, narrowly ahead of HistGradientBoosting at 0.742 and XGBoost at 0.741. The result supports a simpler champion rather than assuming the most complex model must win.
Q4. Does the selected model generalize to the untouched final month?
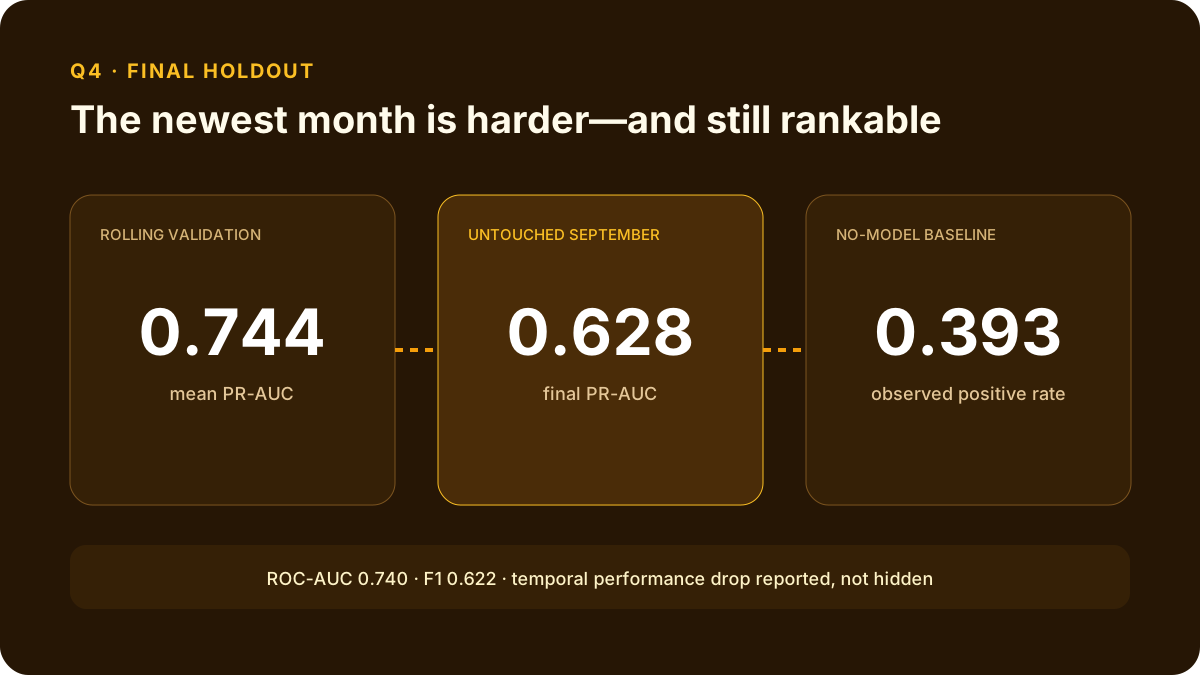
Question: Does the rolling-validation winner maintain its performance on a completely unseen September 2011 customer snapshot? Analysis: After model selection, Logistic Regression is refit on eligible snapshots through June 2011 and evaluated once on 2,772 September customers. The positive-class baseline is the observed 39.3% inactivity rate. Finding: Final PR-AUC is 0.628 versus a 0.393 no-model baseline; ROC-AUC is 0.740 and F1 is 0.622. The decline from 0.744 rolling-validation PR-AUC is retained as evidence of temporal distribution change—not hidden by reporting only the best cross-validation result.
Q5. What does the model change under limited retention capacity?
Question: If the business can contact only 10% of recent customers, how concentrated is inactivity in the highest-risk group? Analysis: I rank final-test customers by predicted risk and evaluate the highest-risk 10% using precision, recall, and lift. Risk deciles and calibration compare predicted probabilities with observed inactivity. Only aggregate outputs are retained; no public customer-level list is exported. Finding: The top-risk 278 customers have a 74.8% observed inactivity rate, capture 19.1% of all inactive customers, and provide 1.90× lift over untargeted selection. This supports prioritization, not a claim that outreach will cause retention; incremental impact and ROI require a randomized experiment with margin and treatment-cost data.