E-commerce Sales Analytics: From Raw Transactions to Reliable Business Metrics

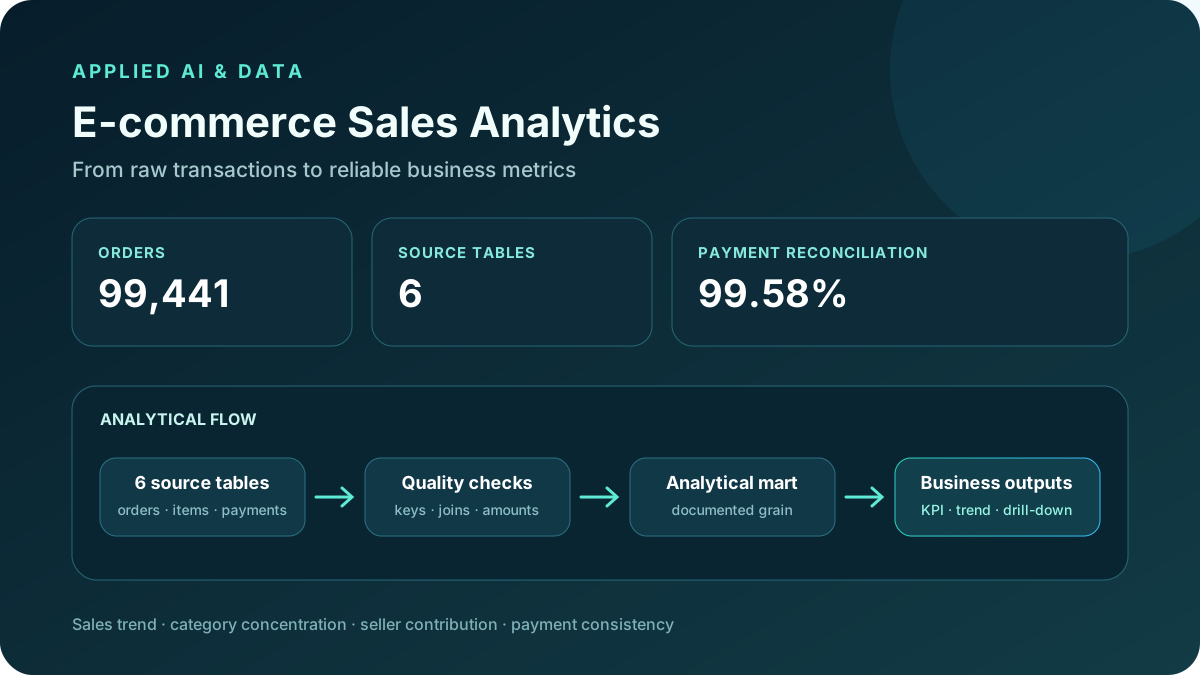
99,441
Orders
6
Source tables
99.58%
Payment match
Tech Stack
Description
This project analyzes e-commerce transaction data to understand sales performance and verify that the reported metrics are reliable.
Starting from six relational tables containing orders, order items, payments, customers, products, and sellers, it answers four practical questions: How did sales change over time? Which categories drive merchandise value? How concentrated is seller contribution? Do recorded payments reconcile with order totals?
The final result is a reproducible SQL and Python analytics workflow rather than a static dashboard. The pipeline validates source relationships, controls the analytical grain, builds reusable tables, and produces business-ready metrics and visualizations.
- 99,441 orders and 112,650 order-item rows across six related source tables.
- Four decision-oriented analyses covering time, categories, sellers, and payment consistency.
- Order-level payment aggregation prevents duplicate totals across one-to-many relationships.
- Automated key, relationship, missing-category, and payment-reconciliation checks.
- Explicit limitations separate measured findings from unsupported profit, funnel, and causal claims.
Project Highlights
Q1. How Did Sales Performance Change Over Time?
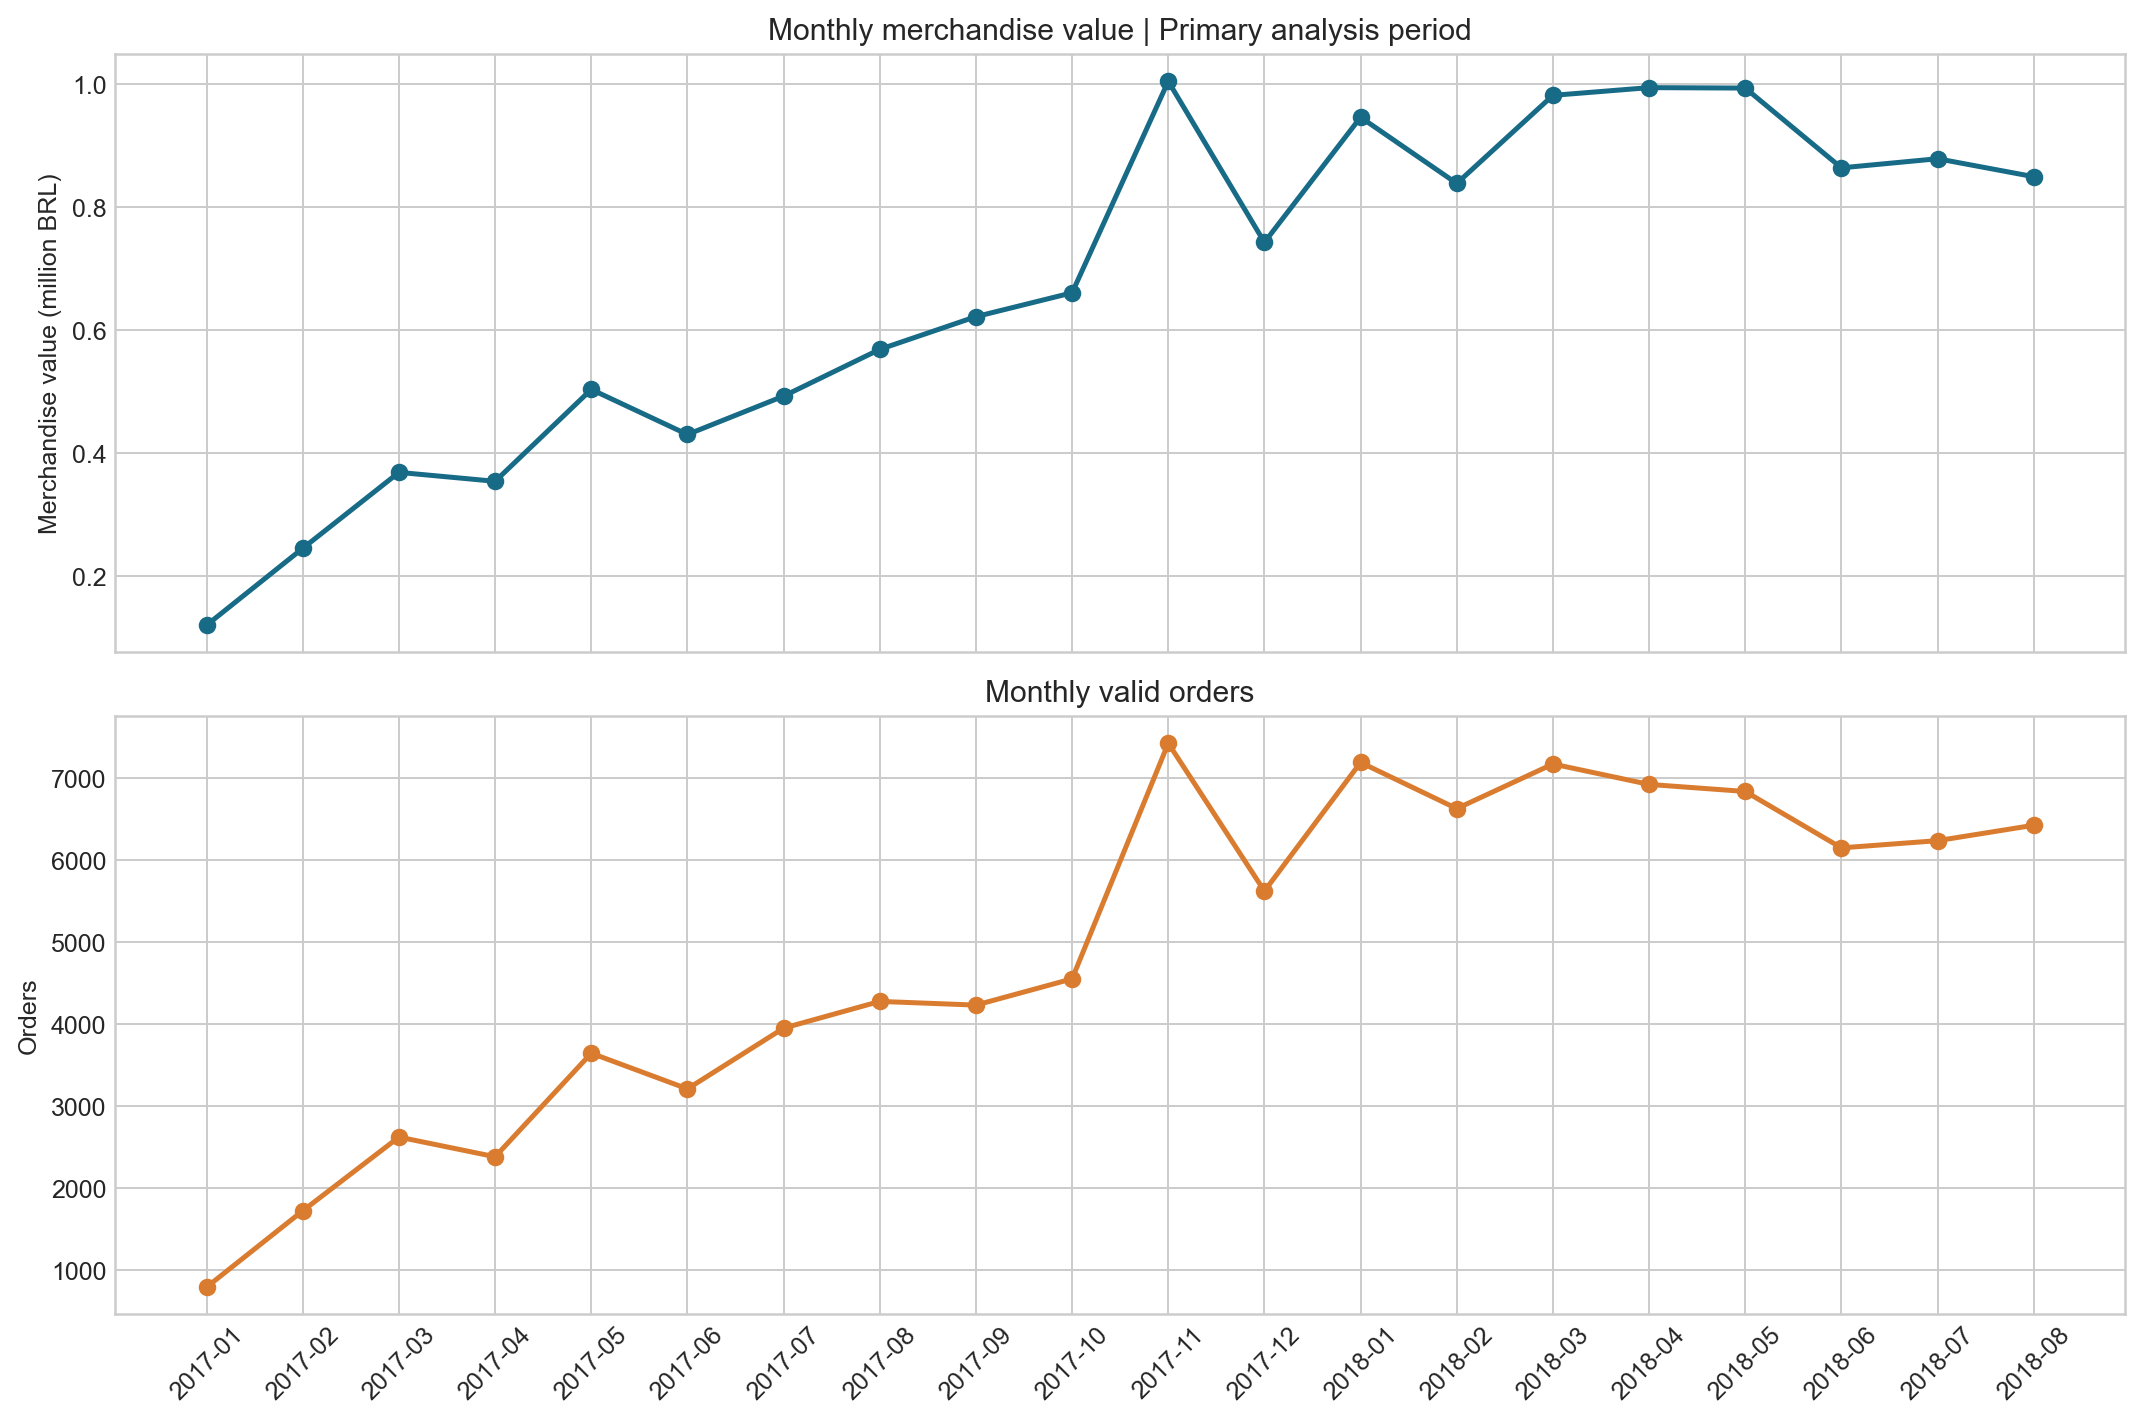
Question: How did merchandise value and valid order volume change over time? Analysis: I aggregated valid order items by purchase month. Because the boundary months are sparse, I used January–August for the like-for-like annual comparison. Finding: Merchandise value increased from BRL 3.08M in January–August 2017 to BRL 7.34M in the same period of 2018, an increase of 138.28%. Valid orders increased by 137.26%. This describes what happened in the dataset; it does not establish what caused the increase.
Q2. Are Sales Concentrated in a Few Product Categories?
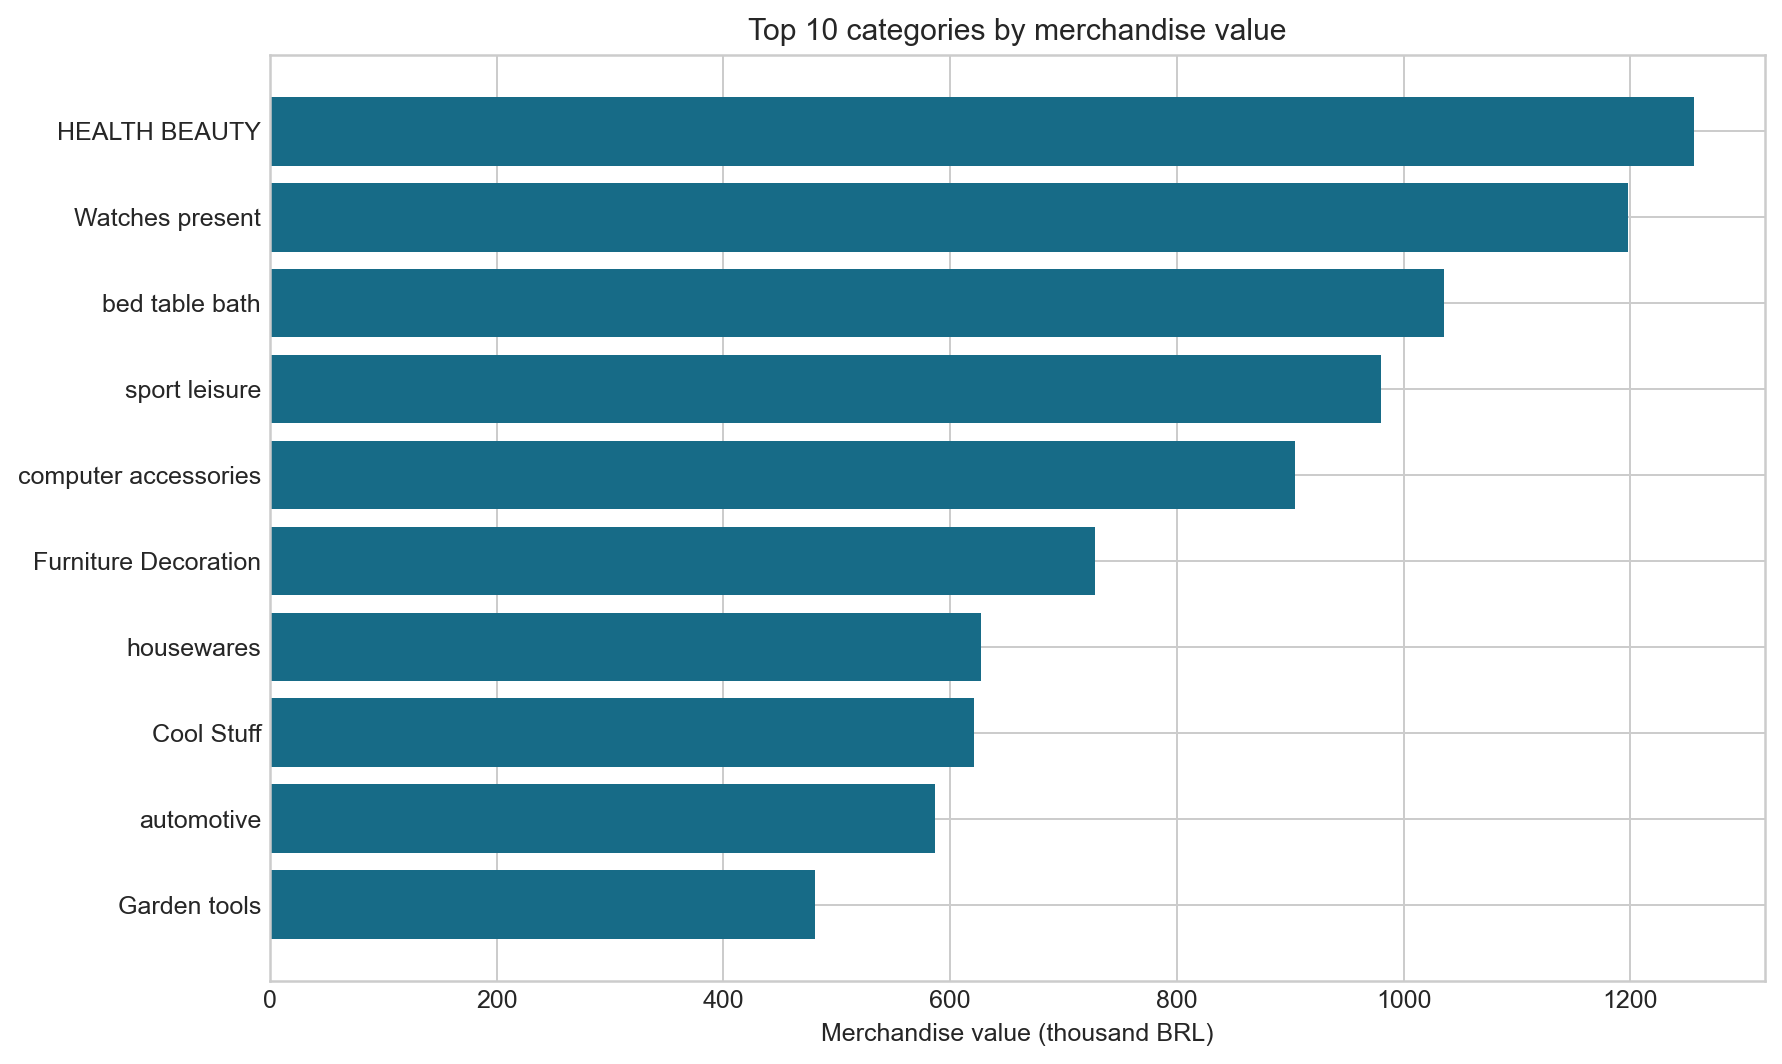
Question: Do a small number of product categories account for most merchandise value? Analysis: I aggregated merchandise value by product category, ranked the categories, and calculated their individual and cumulative contribution shares. Finding: The largest category contributes 9.31% of merchandise value, the top five contribute 39.83%, and the top ten contribute 62.38%. The portfolio has meaningful category concentration but is not dependent on a single category.
Q3. Is the Marketplace Dependent on a Few Sellers?
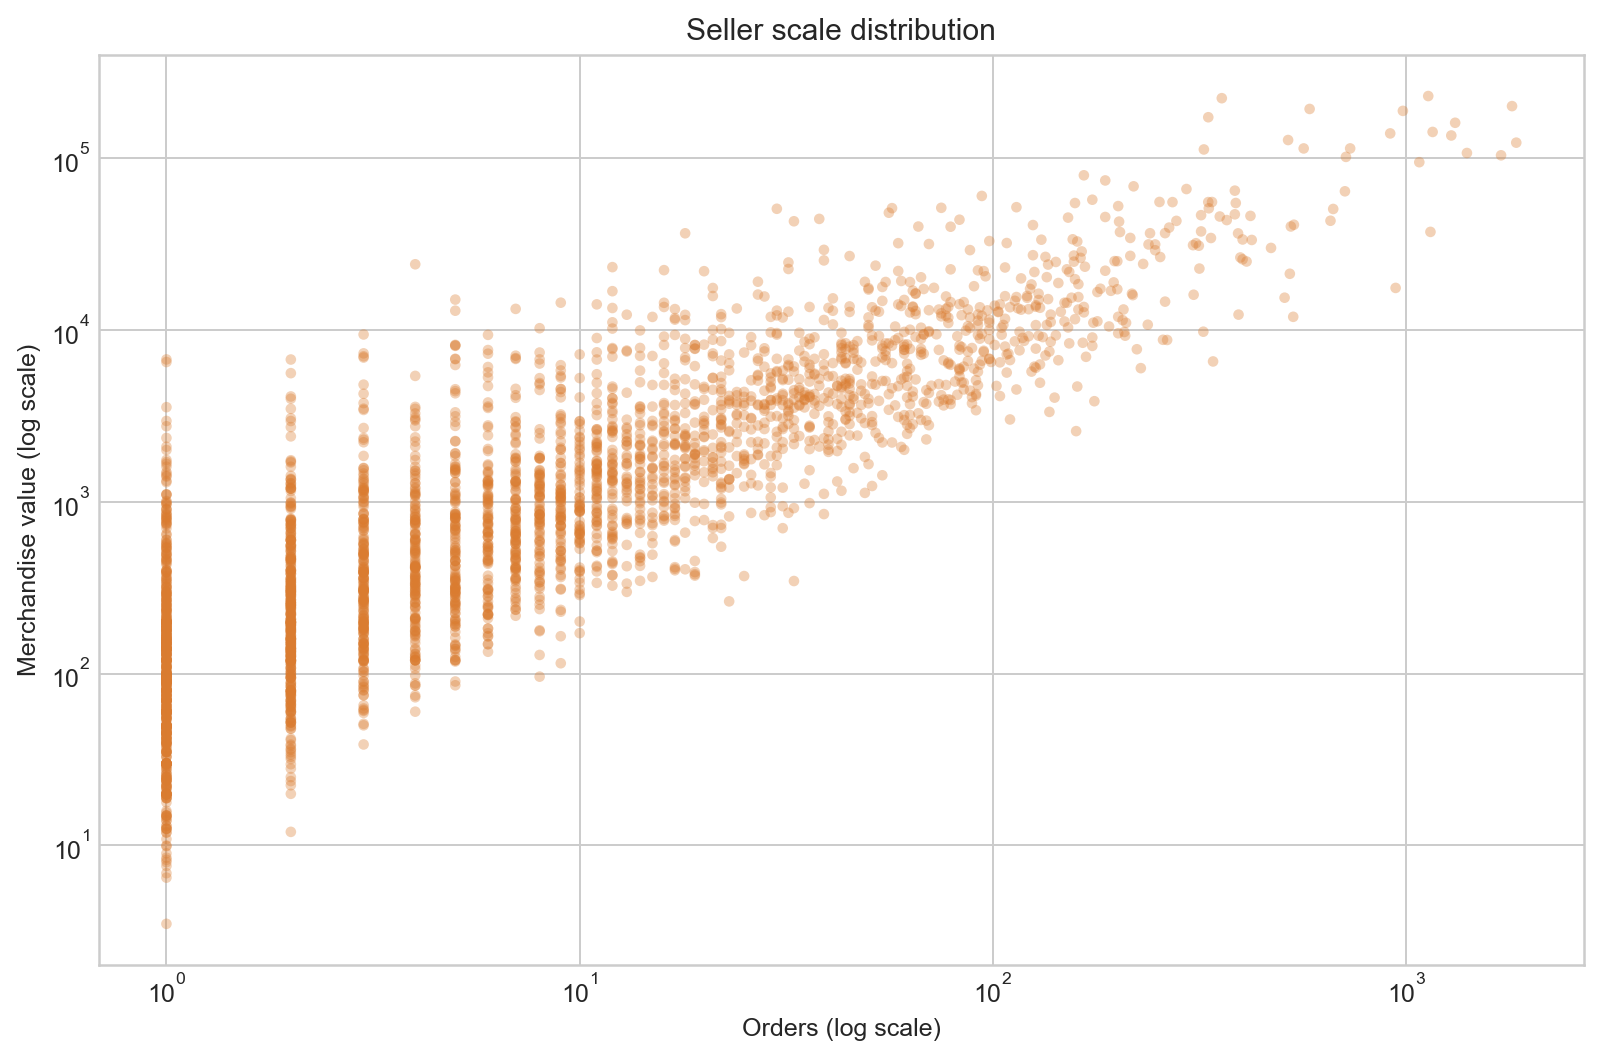
Question: Is merchandise value heavily concentrated among a small number of sellers? Analysis: I aggregated merchandise value at seller level, ranked sellers by contribution, and plotted the distribution on logarithmic axes so that both high-volume sellers and the long tail remain visible. Finding: The top ten sellers contribute approximately 13.20% of merchandise value, while the largest seller contributes about 1.70%. This suggests a relatively distributed seller base rather than dependence on one or two sellers.
Q4. Can We Trust the Reported Transaction Totals?
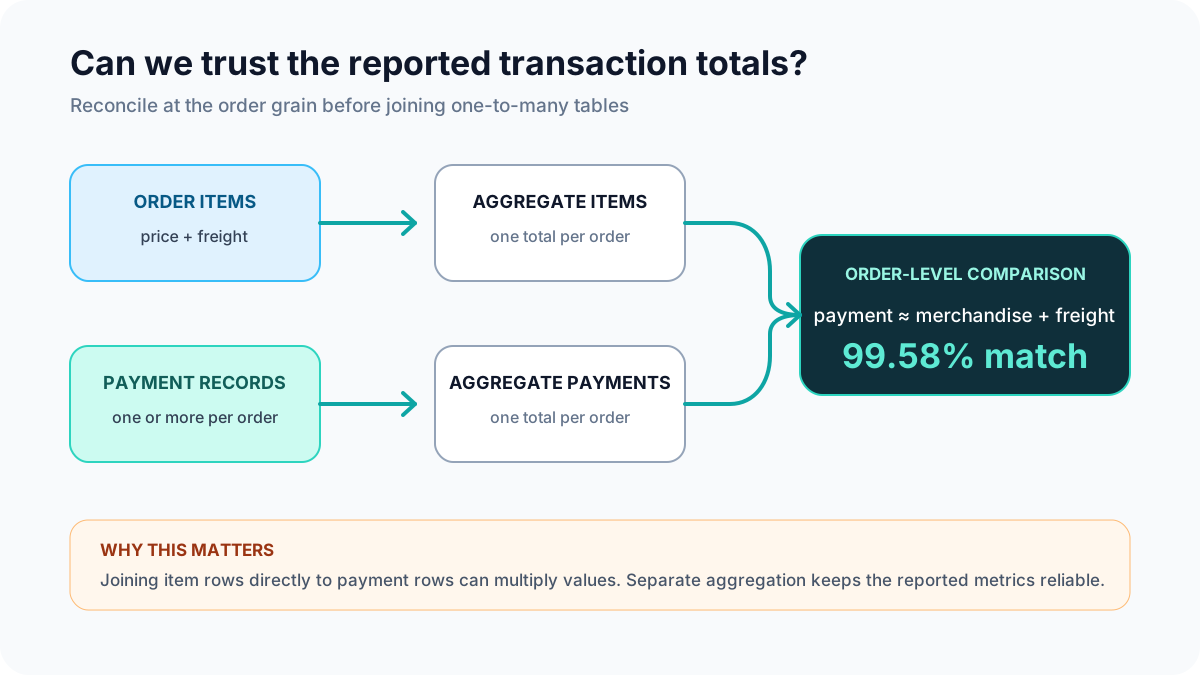
Question: Do recorded payments reconcile with merchandise value plus freight? Analysis: An order can contain multiple item rows and multiple payment records. I first aggregated payments to order level, separately summed merchandise value and freight, and then compared the two order-level totals. This prevents one-to-many joins from inflating revenue. Finding: Among 98,665 reconcilable orders, 99.58% have an absolute difference of no more than BRL 0.01. Remaining exceptions are preserved for investigation rather than silently corrected.
Business Value
The analysis turns raw e-commerce transactions into reliable metrics that can be used to monitor sales performance and investigate business patterns. It helps decision-makers answer four practical questions: • Where is merchandise value growing? — through monthly performance analysis. • Which categories contribute most to sales? — through category and product analysis. • How dependent is the marketplace on a small number of sellers? — through seller concentration analysis. • Which transactions may require investigation? — through payment reconciliation and data-quality checks. The current dataset does not contain product costs, advertising spend, or behavioral-event data. Therefore, the project does not estimate profitability, marketing ROI, or conversion rates. These would be natural extensions of the same analytical pipeline if the required data were available.